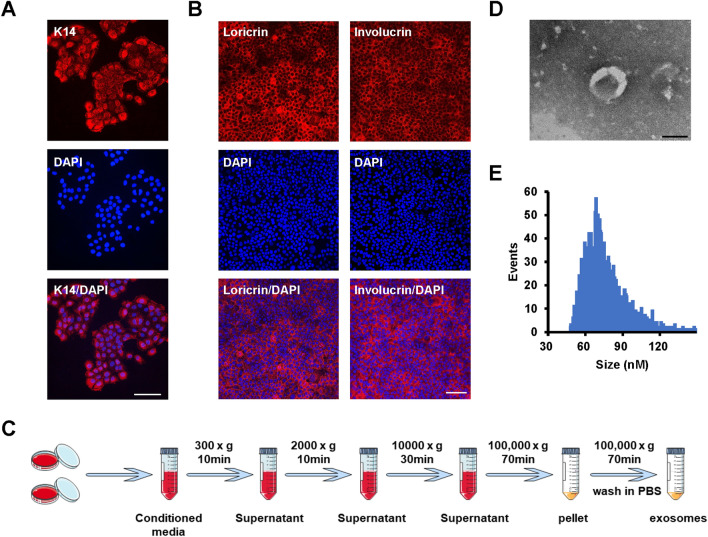
Fig. 1.
Characterization of iPSCs-KCs and iPSCs-KCs-Exos. A Representative images of immunohistochemical staining for K14 in iPSCs-KCs. Scale bar, 100 μm. B Representative images of immunohistochemical staining for involucrin and loricrin in iPSCs-KCs culture for 10 days in DKSFM supplemented with 1.5 mmol/L of CaCl2. Scale bar, 100 μm. Nuclei were stained by DAPI (blue). C Schematic diagram of iPSCs-KCs-Exos extraction process. D The transmission electron microscopy (TEM) image of iPSCs-KCs-Exos. Scale bar, 100 nm. E Nanoparticle tracking analysis (NTA) result of iPSCs-KCs-Exos

