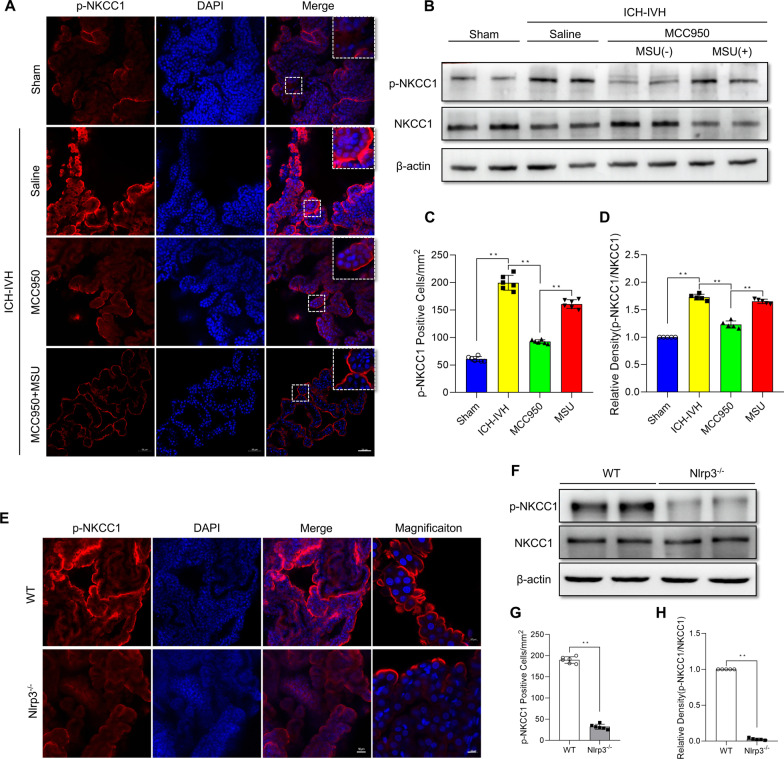
Fig. 7.
Effects of MCC950 or Nlrp3 knockout on p-NKCC1 protein levels after ICH-IVH and different treatments. A, C Representative images of immunofluorescence staining for p-NKCC1 (A) and p-NKCC1-positive cell statistics (C) after inhibition of NLRP3 via MCC950 and reactivation with MSU in the choroid plexus on day 3 (6 rats/group, one-way ANOVA). Bar = 50 μm. B, D Western blot analysis of p-NKCC1 and NKCC1 in the choroid plexus on day 3 (n = 5, 6 rats/group, one-way ANOVA). E, G p-NKCC1 staining images of the choroid plexus (E) and statistical results of p-NKCC1-positive cell counting (G) in control and Nlrp3−/− rats after ICH-IVH (6 rats/group, Welch’s two-tailed unpaired t-test). F, H Quantitative analysis of p-NKCC1 and NKCC1 levels in the choroid plexus in control and Nlrp3−/− rats after ICH-IVH (n = 5, 6 rats/group, Welch’s two-tailed unpaired t-test). C, D ICH-IVH indicates ICH-IVH (WT) + saline; MCC950 indicates ICH-IVH (WT) + MCC950; MSU indicates ICH-IVH (WT) + MCC950 + MSU. The values are expressed as the means ± SDs; **p < 0.01; *p < 0.05

