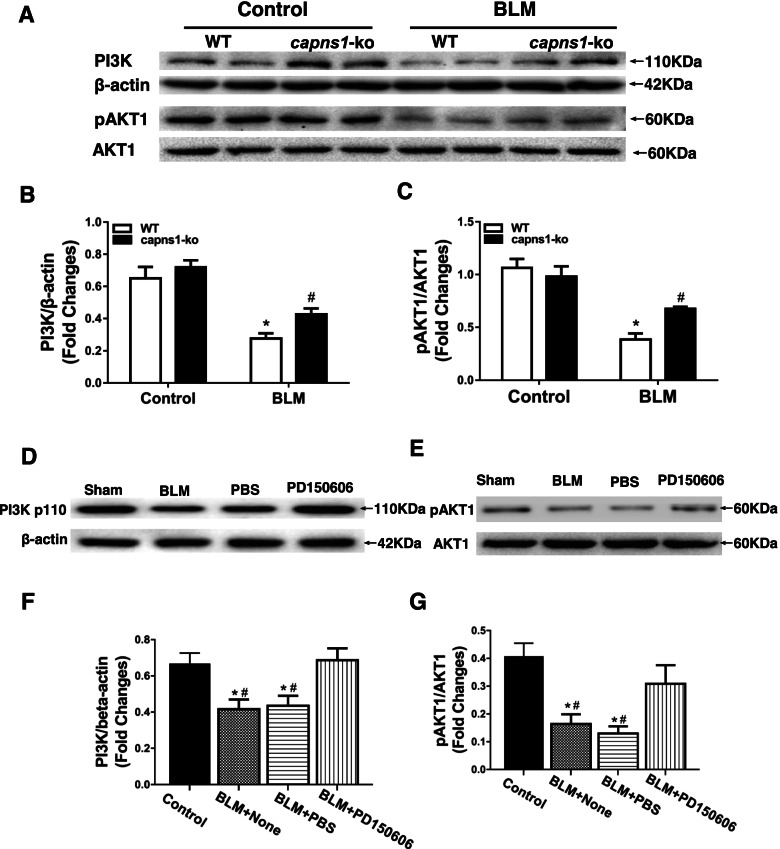
Fig. 8.
Analysis of PI3K levels and activated AKT1 in lung tissues of the bleomycin model of SSc mice. (A)Lung tissues of sham treated (Control) or BLM treated (bleomycin model of SSc) WT or Capns1-ko mice were subjected to SDS PAGE and immunoblotting for PI3K, AKT1, pAKT1 and β-actin. (B, C) Levels of the proteins assessed in (A) were quantified by densitometry. (D, E) C3H/He mice were subjected to either sham treatment (Control) or BLM and then treated with PBS or calpain inhibitor (PD150606; 3 mg/kg/day, i.p.) or PBS (vehicle) for 30 days. Lung tissues were then analyzed as in (A); and (F, G) quantified as in (B, C). The PI3K and pAKT1 protein in different groups were done by Western blotting analysis (A). The test of Homogeneity of variance showed P < 0.1, nonparametric test was applied. The grayscale levels of PI3K and pAKT1were much greater in the WT mice of SSc model versus WT mice in sham group with significant difference and significantly decreased in Capns1-ko mice in SSc model in comparison to WT mice in SSc model (B,C). Also, the PI3K and pAKT1 protein in different groups were done by Western blotting analysis (D). The test of Homogeneity of variance showed P > 0.1, AVONA test was applied. The grayscale level of PI3K was much greater in the BLM + None and BLM + PBS group versus sham group with significant difference and significantly increased in BLM + PD150606 group in comparison to BLM + None group (F).The pAKT1 and AKT1 protein in different groups were done by Western blotting analysis (E). Also, the grayscale level of pAKT1 was much greater in the BLM + None and BLM + PBS group, esp. in BLM + PBS group, versus sham group with significant difference and significantly increased in BLM + PD150606 group in comparison to BLM + None group (G). Data are mean ± SD. n = 7, * P < 0.05 in comparison to Sham group; # P < 0.05 in comparison to BLM + PD150606 group

