
Extended Data Fig. 3 ∣. Lymphocyte velocity at 600 μm with increasing pulse energy and average power at 1300 nm excitation.
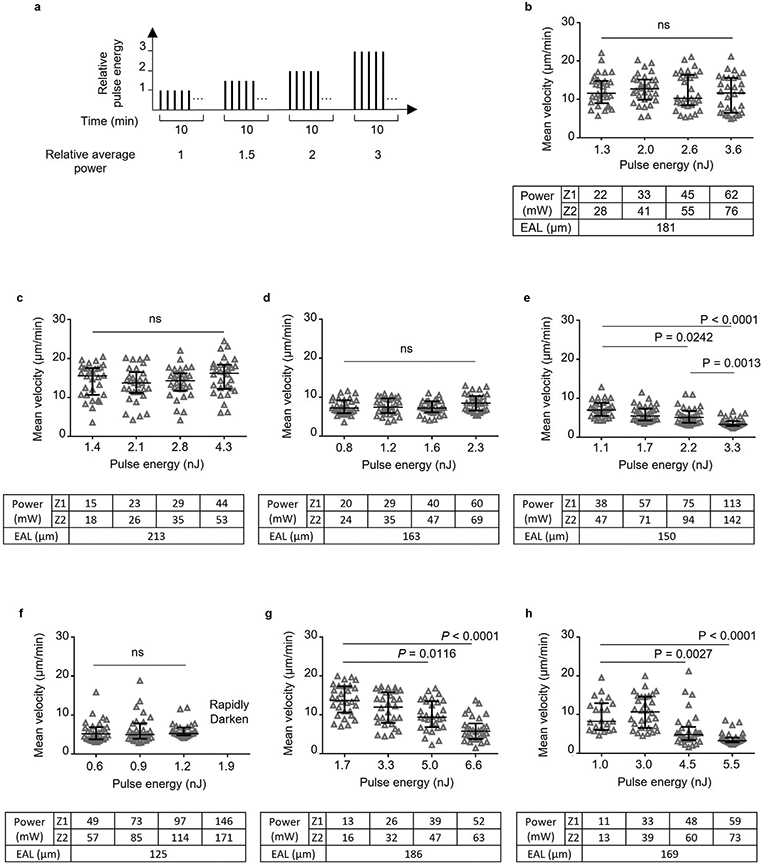
a, Schematic of adjusting pulse energy and average power for taking the four 10-min movies sequentially. The average power is proportional to the pulse energy since the repetition rate was kept constant. b-h, eGFP+ lymphocyte velocity was measured at the same site with 4 different pulse energies (at focus) by 3PE at 1300 nm. Pulse repetition rates of 0.66 and 0.33 MHz were used for b-f and g-h, respectively. Power, average power at surface. Seven LNs from 6 mice were imaged.The exact imaging depth was from 590 μm to 625 μm. The average power increases with depth from top (Z1) to bottom (Z2) of the imaging volume. Effective attenuation length (EAL) was calculated by taking 4 images at different depths. Each data point indicates an individual lymphocyte track; n = 30 tracks (except for n = 22 tracks at 1 nJ in h); the median with the interquartile range; ns, not significant; Kruskal-Wallis test followed by Dunn’s multiple comparisons test. The image rapidly darkened within a few minutes when we applied more than 146 mW in f (Supplementary Movie 3). The velocity even at relatively low power and low pulse energy in d-f is lower than 10 μm/min because the imaging site was close to LN boundary (sub-cortical region). This observation is consistent with previous reports that the velocity of both T and B cells in subcortical region is 6–8 μm/min (ref. 30).