Figure 3.

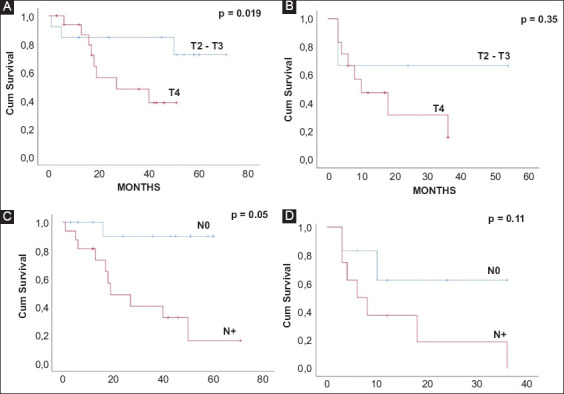
Kaplan-Meier curves of overall survival and disease-free survival stratified by tumor stage (panels A and B) and by lymph node status (panels C and D)

Kaplan-Meier curves of overall survival and disease-free survival stratified by tumor stage (panels A and B) and by lymph node status (panels C and D)