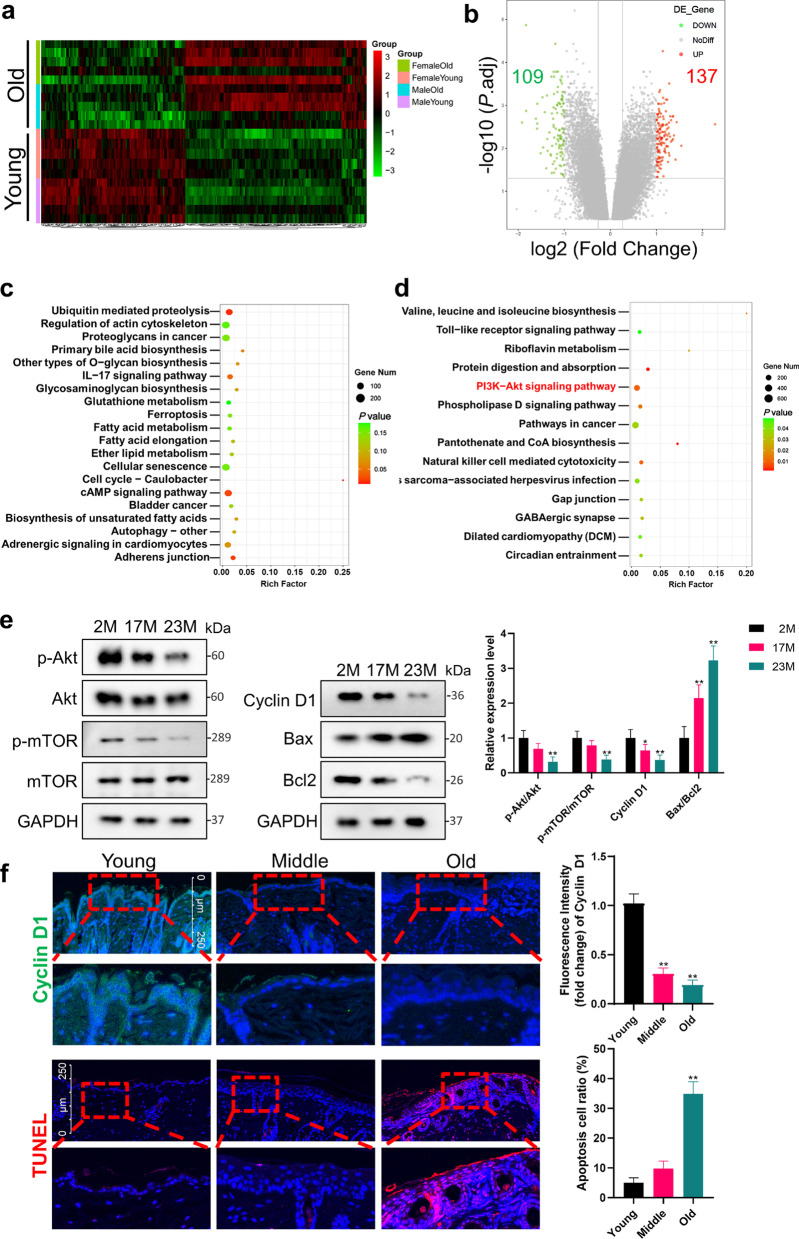
Fig. 1.
Transcriptome changes in skin aging and age-related changes in Akt/mTOR pathway. a–d The skin RNA-seq data of young (5 months) and old (30 months) CB6F1 mice (from GEO series GSE35322) were analyzed with the screening criteria: P.adj < 0.05. Number of animals: 10 for each age group, containing 5 males and 5 females. a Heat map of differentially regulated transcripts between groups. Green color denotes low FPKM expression, red high FPKM expression. b Volcano plot of differentially regulated genes between groups. Dots with fold changes greater ± two fold and P.adj < 0.05 were marked red or green. c, d The upregulated and downregulated genes were enriched by KEGG and displayed in the scatter diagram. e Western Blot was used to measure the phosphorylation of Akt and mTOR in epidermis from the back of 2 M, 17 M and 23 M rats. Proliferation ability is compared by Cyclin D1. The apoptosis level is indicated by the ratio of Bax to Bcl2. N = 6. *P < 0.05, **P < 0.01 versus the 2 M group. f Immunofluorescence images of young, middle and aged mice skin labeled with antibodies against Cyclin D1 [secondary antibodies are color-coded as shown]. TUNEL staining is used to mark apoptotic cells. Sections were co-stained with DAPI (blue) to visualize nuclei. N = 6. Scale bar, 250 μm. The box area besides each photomicrograph shows an enlarged version of the red square. *P < 0.05, **P < 0.01 versus the young group

