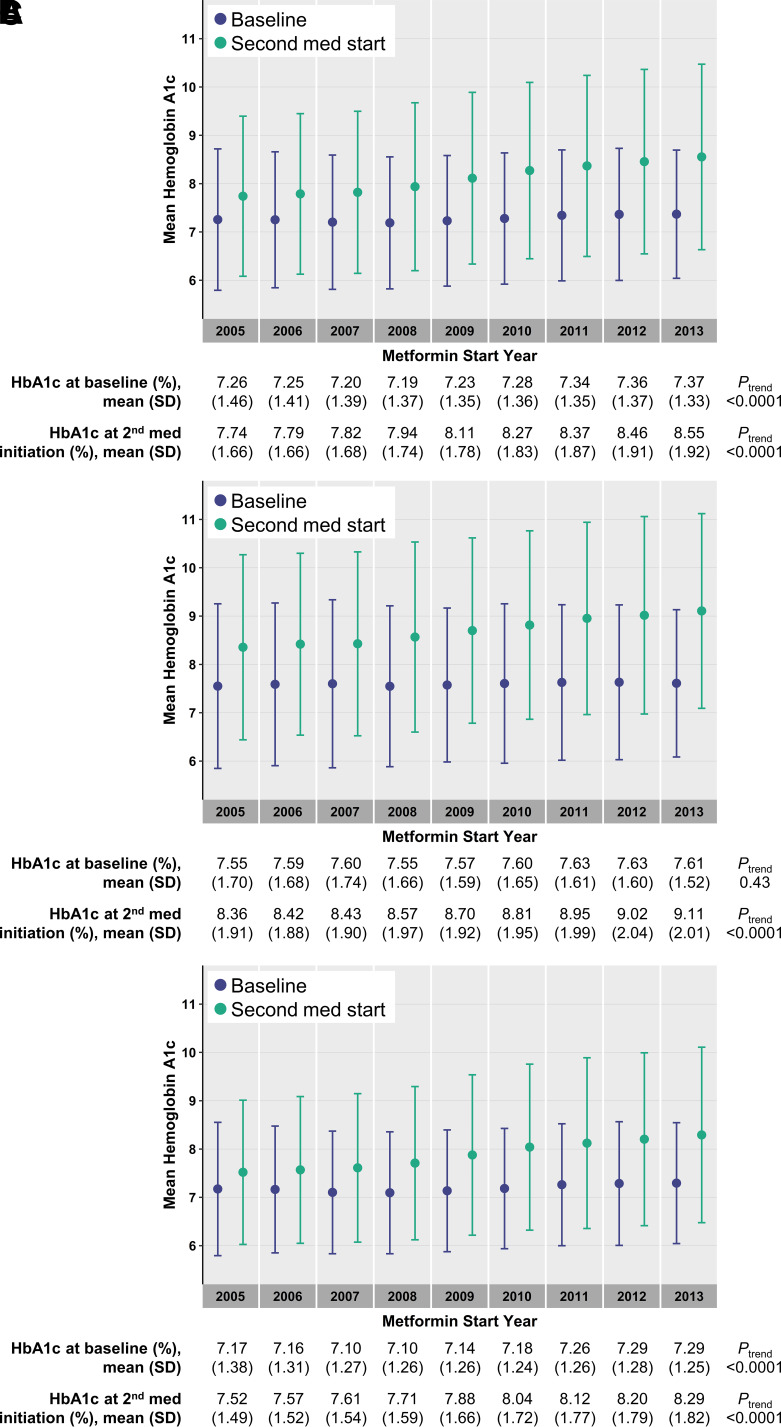
Figure 1.
Trends in HbA1c at baseline and at time of initiation of second diabetes medication. Points and vertical bars represent the mean and SD of HbA1c for each year in the full sample (A) and among individuals initially treated with metformin at ages ≤55 years (B) and >55 years (C). Baseline values are shown in purple, and values nearest to the start of second-line diabetes treatment in those who were prescribed second-line treatment within 5 years are shown in green. The mean and SD values corresponding to each plotted point are shown below the plots, along with P values for temporal trends from models with adjustment for sex, race, and baseline age, HbA1c, creatinine, and BMI.

