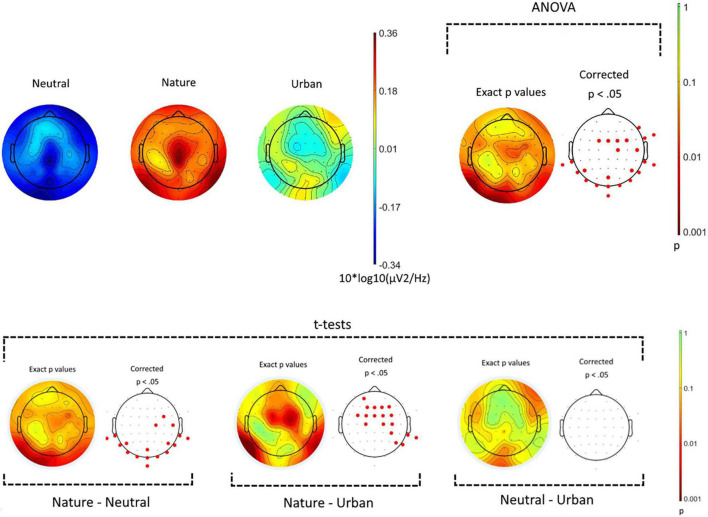
FIGURE 4.
Spatial distribution of power spectral density for early-alpha frequency band (8–11 Hz). The top panel shows the power spectral density for the three experimental conditions (neutral, nature, and urban videos). On the top-right side, the results from the ANOVA showing in red the electrodes where ps < 0.05. The bottom panel show the results of the post hoc t-tests.

