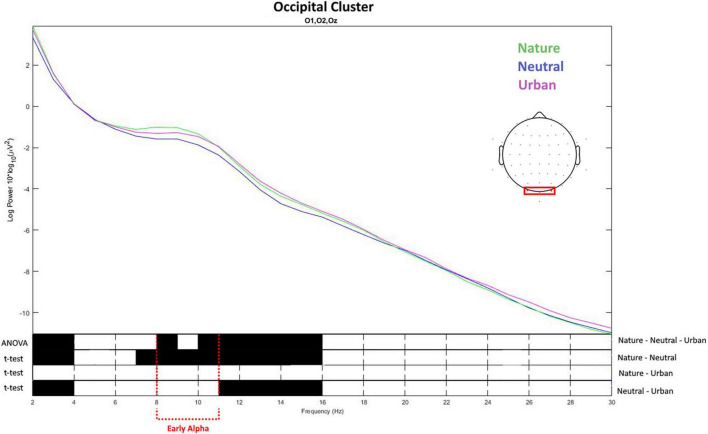
FIGURE 7.
The top of the figure presents the values of spectral power obtained averaging the values for the electrodes placed over the occipital brain area. The frequency (X-axis) and spectral power (Y-axis) for the three experimental conditions (neutral, nature, and urban videos). The bottom of the figure shows the results of ANOVA and t-tests for the difference between the conditions on the spectral power for each frequency from 2 to 30 Hz. Black color shows the frequency values in which the spectral power values were statistically different between the conditions.

