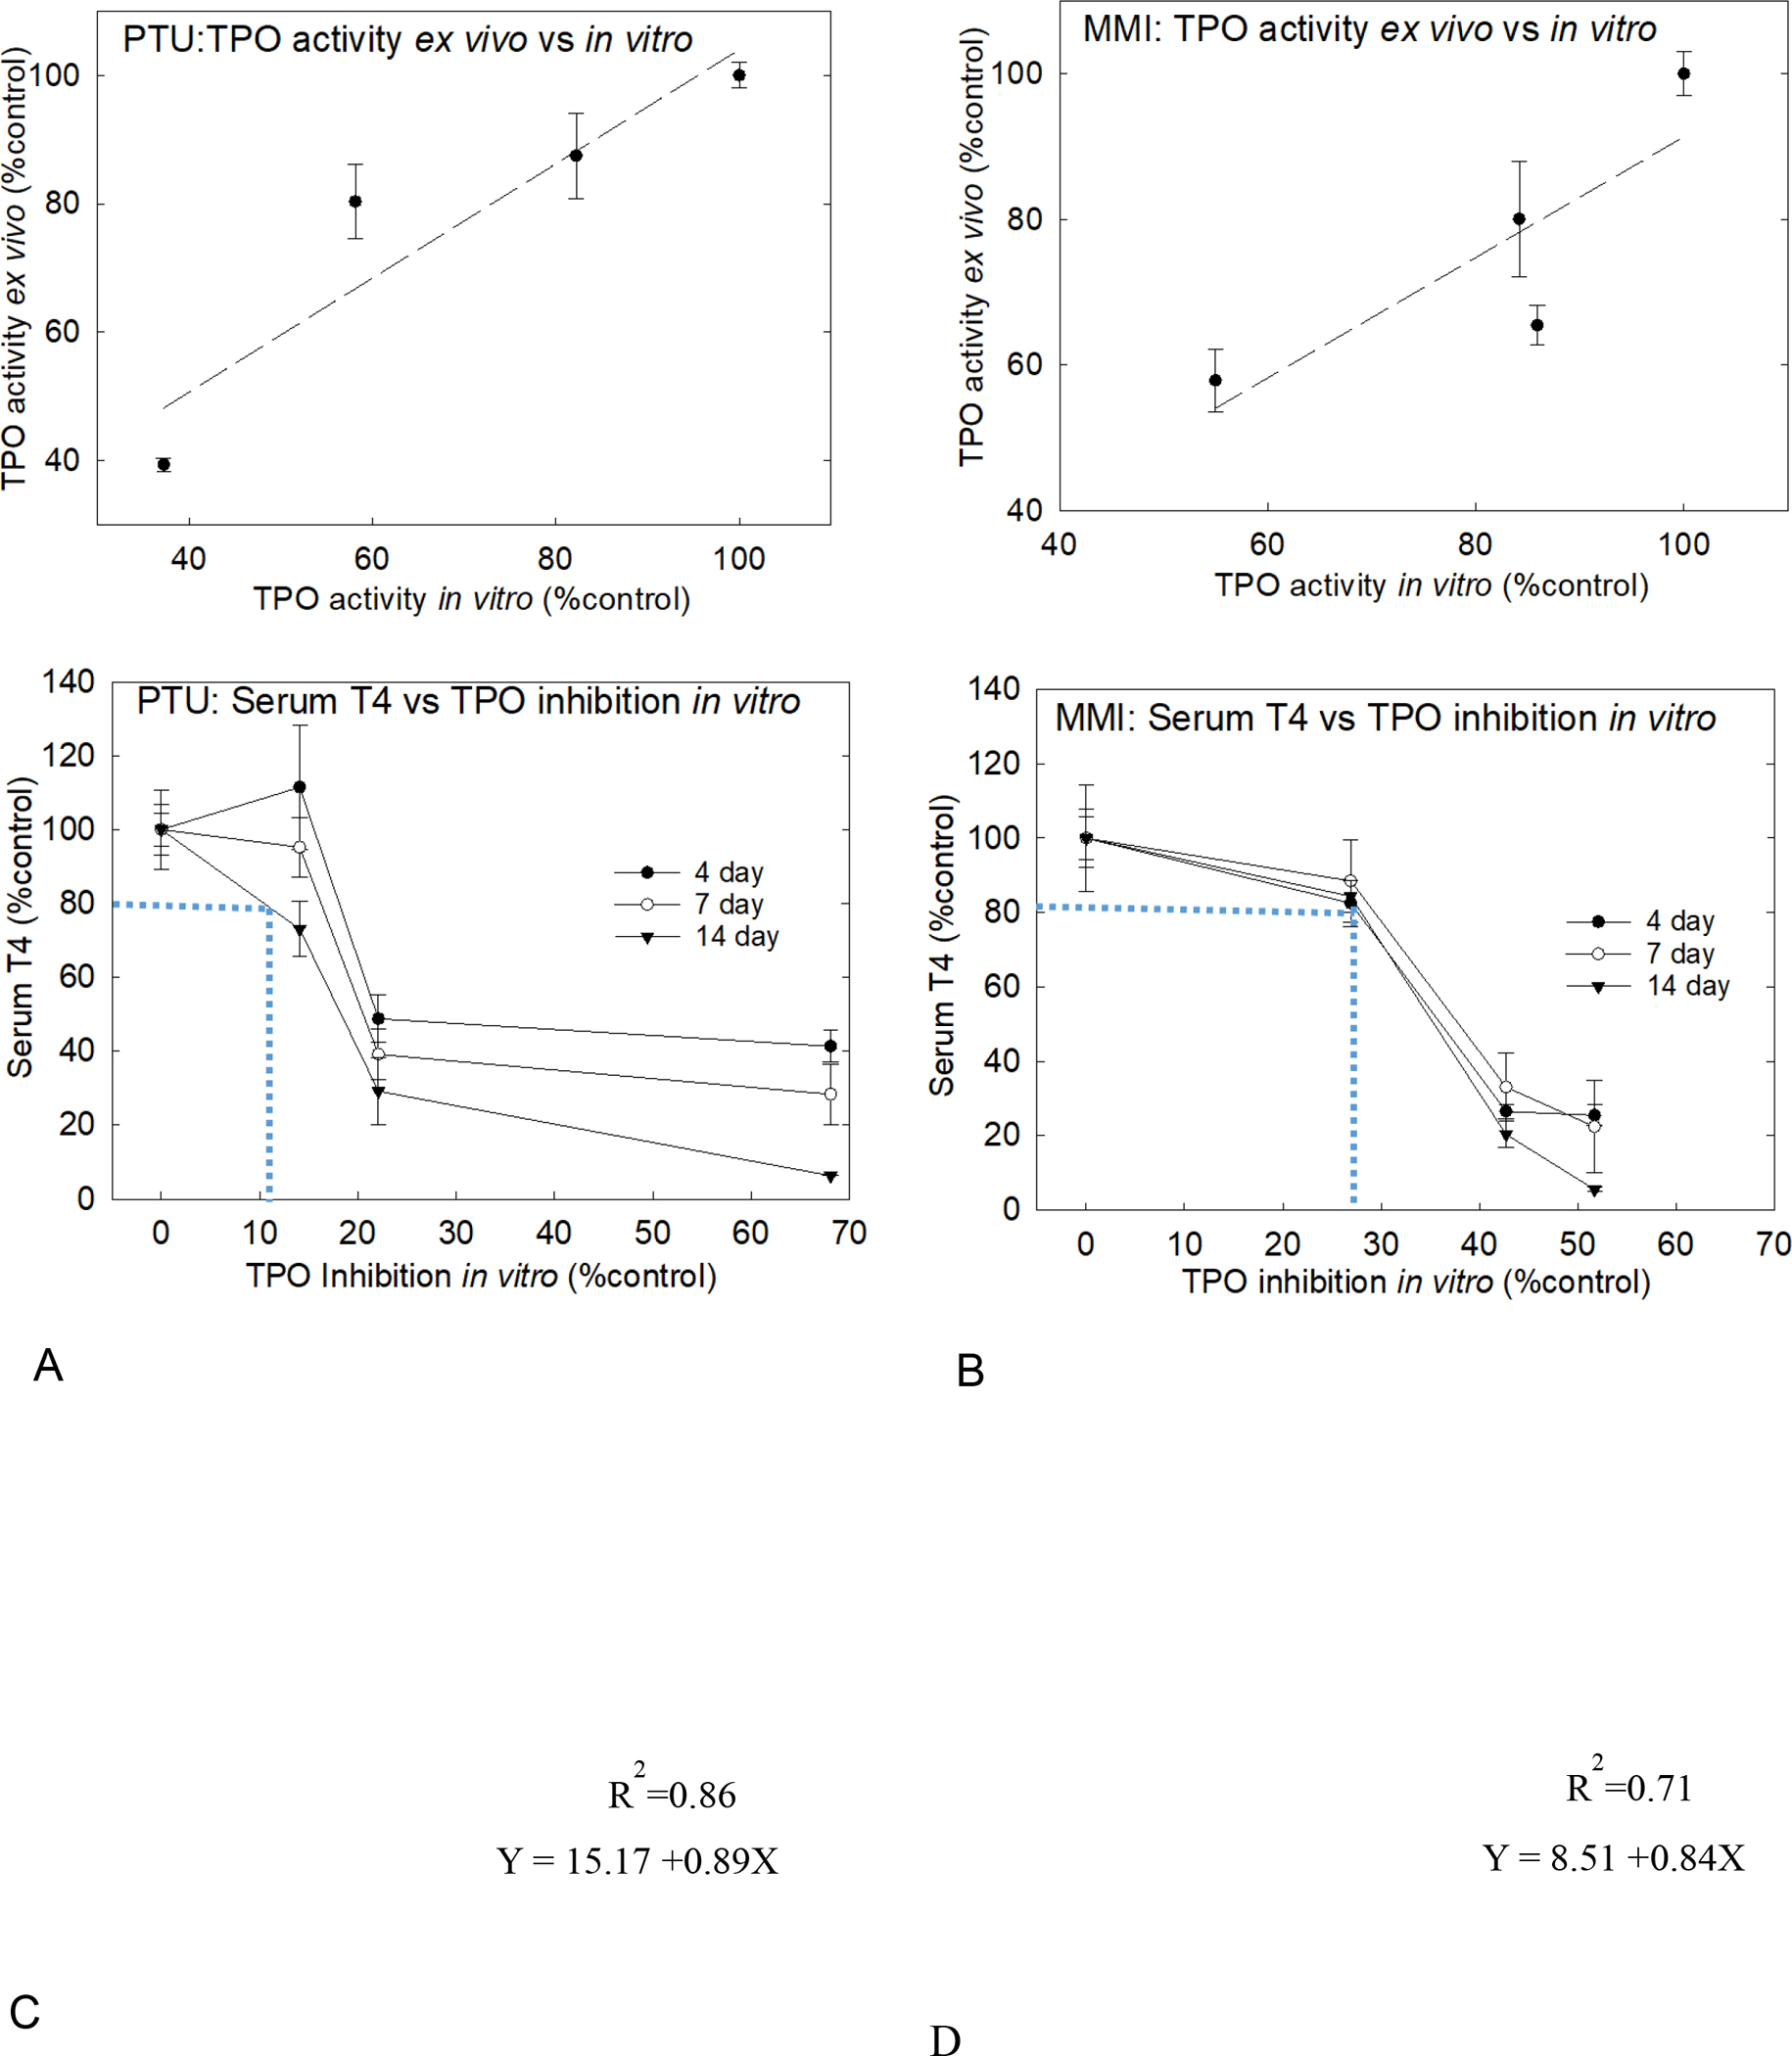
Figure 4: Quantitative relationships ex vivo and in vitro extrapolation.

All values plotted as percent control. A) Ex vivo measure of TPO inhibition versus TPO activity for PTU exposure was determined using AUR assay. B) Ex vivo TPO activity correlate well to glandular PTU levels as a linear relationship. C) Examining the relationship between TPO inhibition in vitro, the dotted blue line demonstrates that 10% inhibition in TPO activity in vitro by PTU corresponds to 20% decrement in serum T4 level at 14-day exposure duration. D) For MMI, 20% decline in serum T4 corresponded to 28% TPO inhibition in vitro in the 14-day dosed rats.
