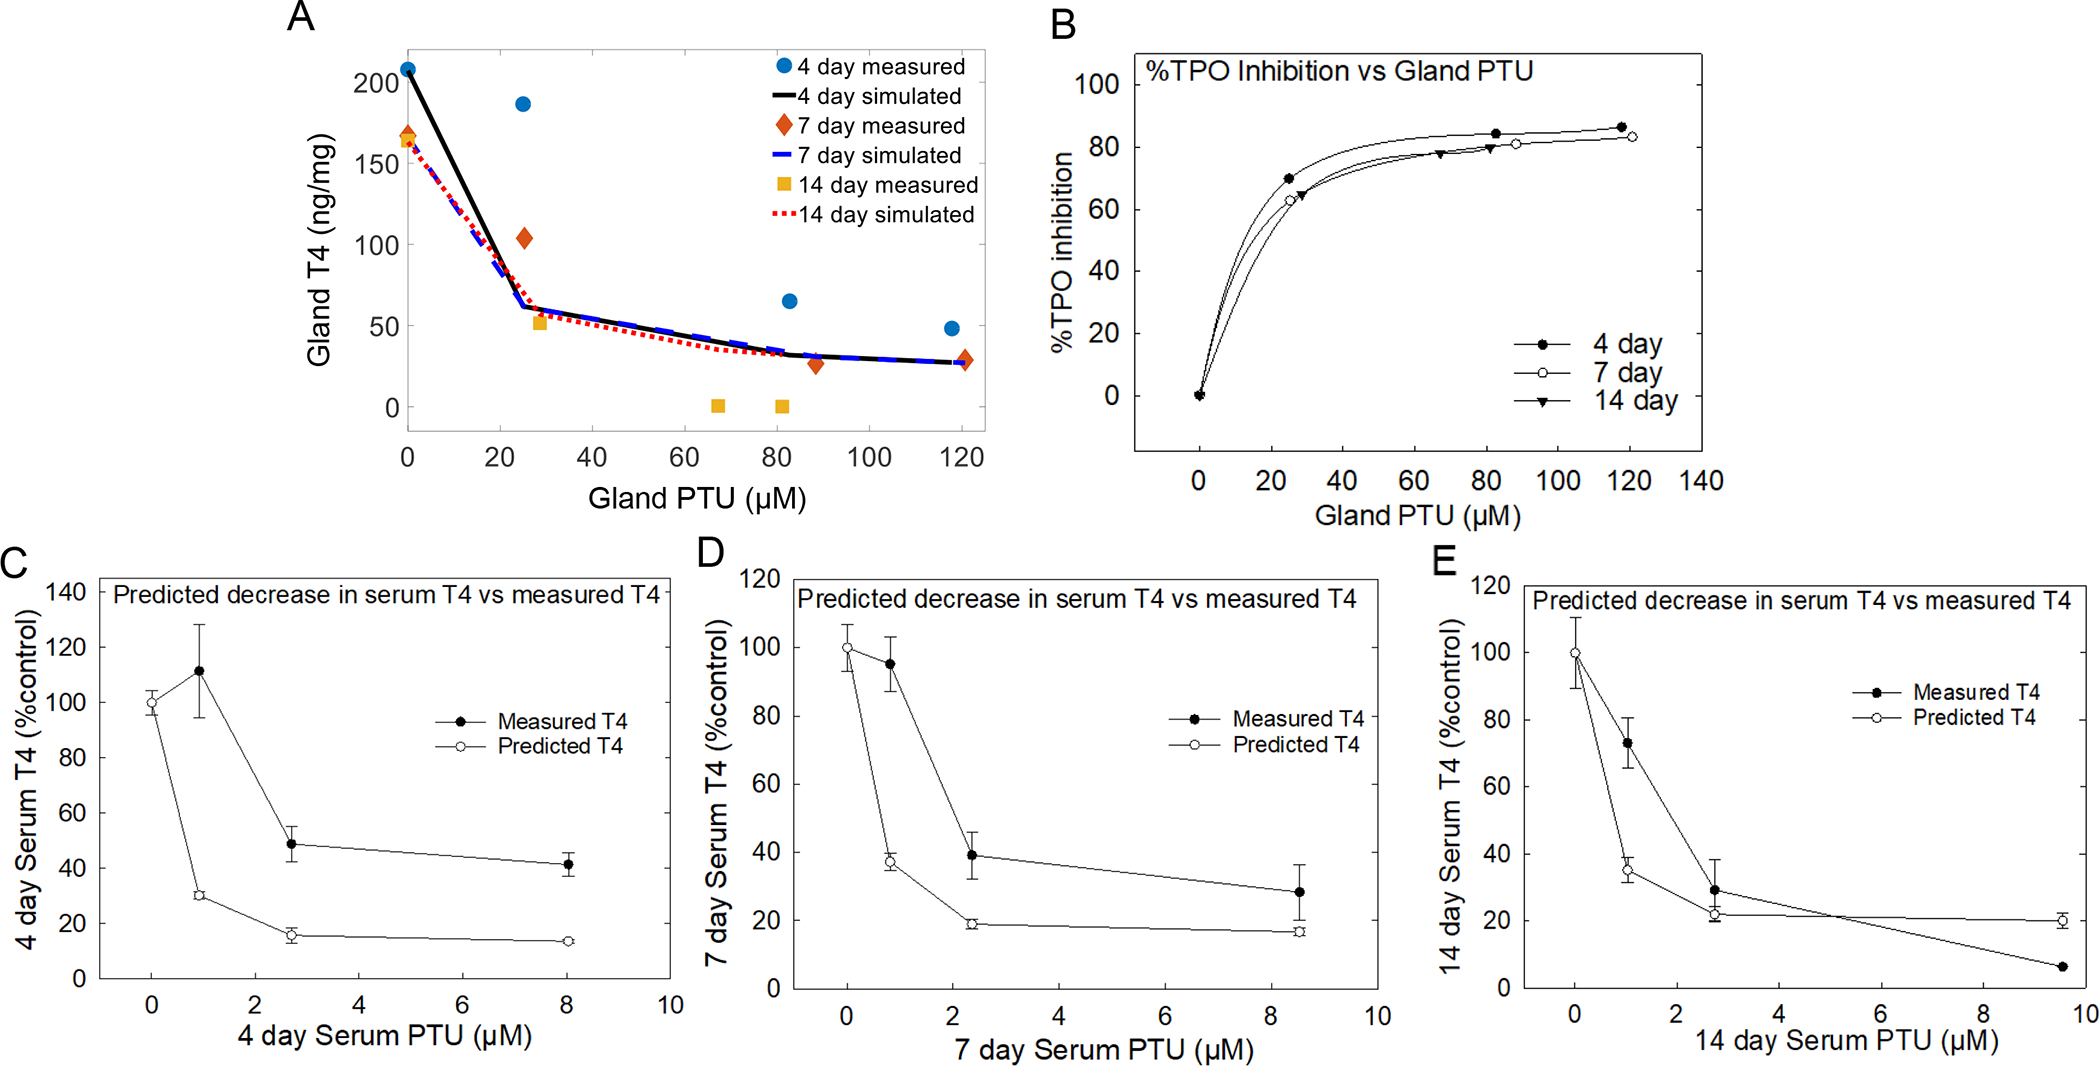
Figure 5. PTU computational model and extrapolation of in vitro responses to in vivo serum T4 levels.

A) in vitro PTU IC50 value of 1.2 μM used to estimate the degree of TPO inhibition for all exposure to points. TPO estimate was better at all doses with 7 and 14-day exposures than 4-day time point and the estimation for 4-day were better at higher PTU doses. B) Degree of TPO inhibition is translated to percent TPO inhibition at all timepoints versus gland PTU levels. C, D, and E) Results demonstrate that the percent TPO decrease, obtained from the simulated degree of TPO inhibition, when applied to serum T4 provides levels that closely aligns with measured serum T4 at 14 days of exposure compared with 4 and 7-day exposures. Error bars represent ± SEM.
