
Figure 6. MMI computational model and extrapolation of in vitro responses to in vivo serum T4 levels.
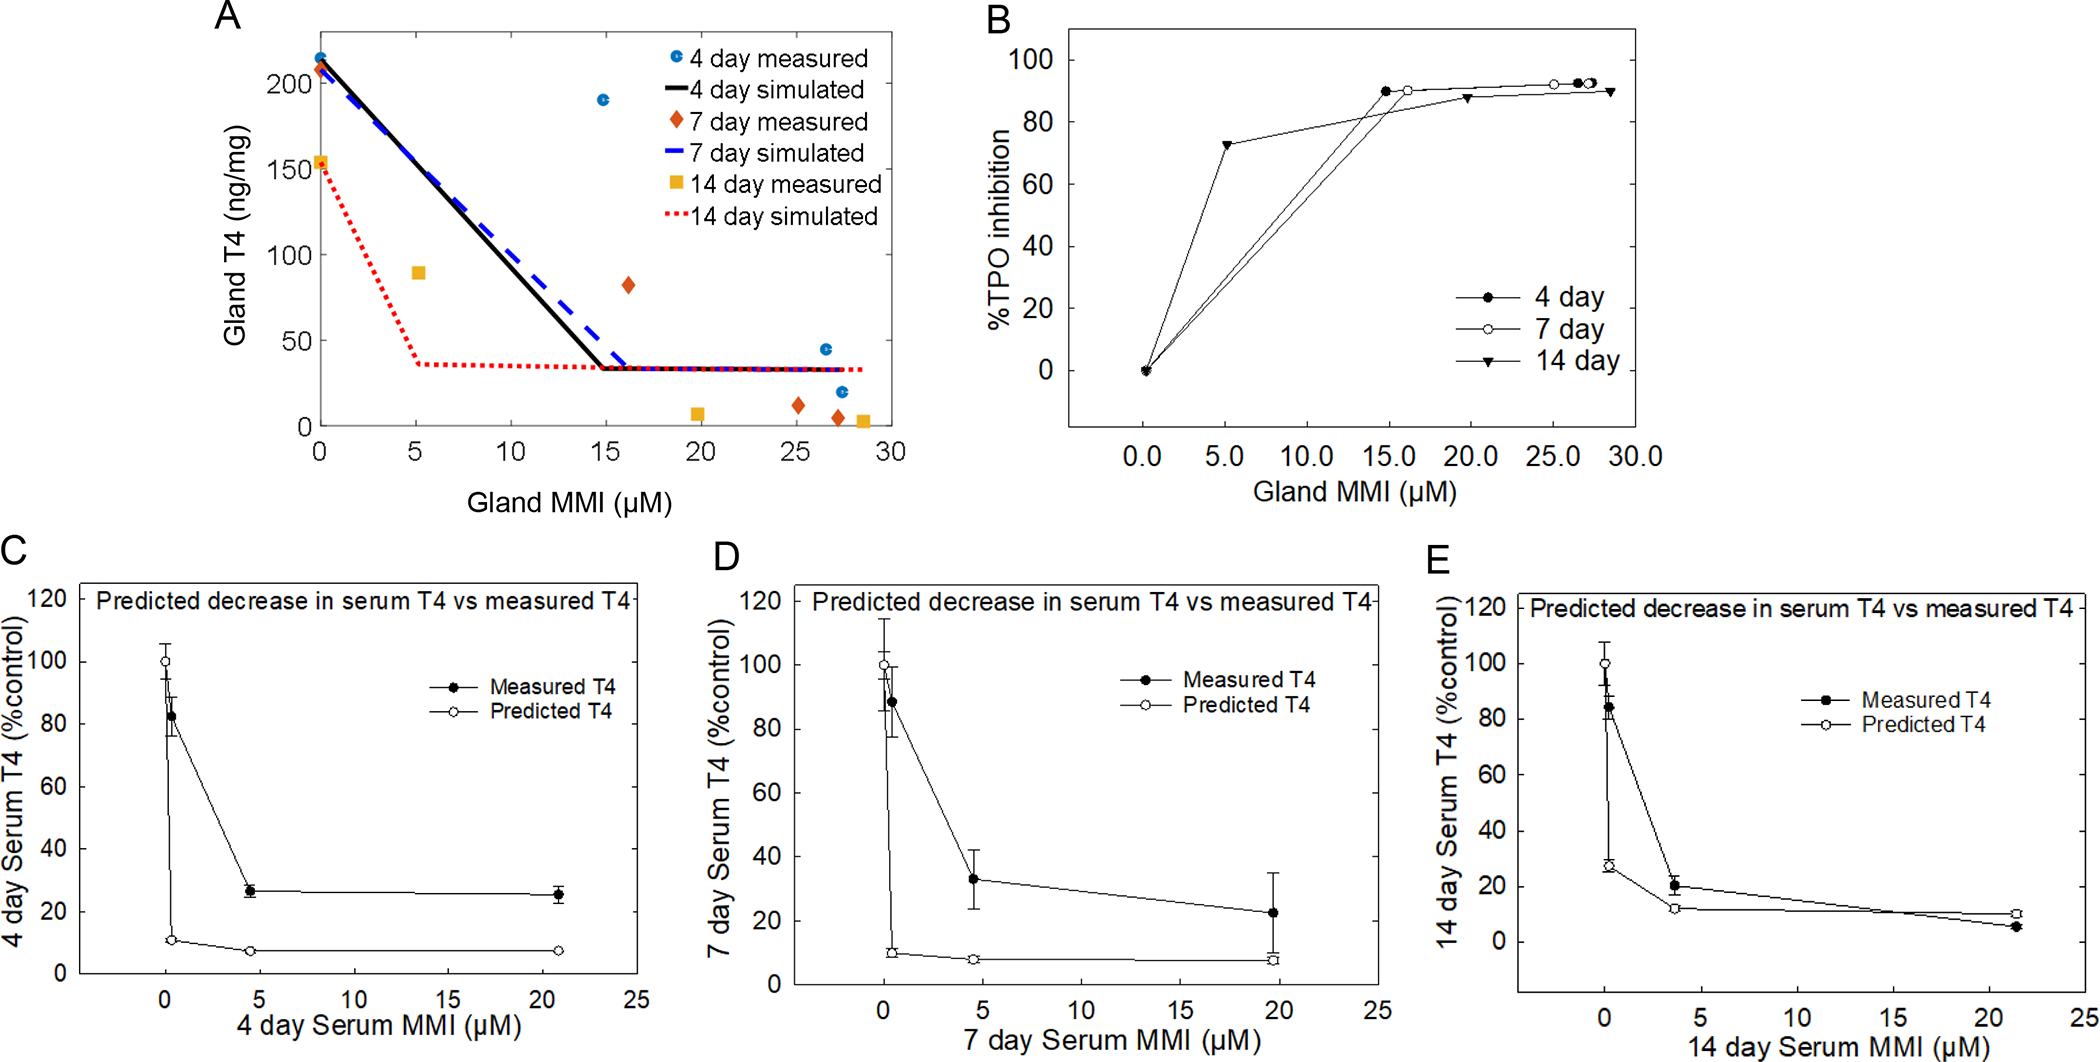
A) Glandular T4 and MMI introduced into an in-silico model to estimate the degree of TPO inhibition resulted in stronger estimation at the lower doses compared with higher doses at all time-points. However, the 7 and 14-day simulations of TPO inhibition provided a better fit of the measured data compared with 4-day estimation of TPO inhibition. B) Translation of the simulated degree of TPO inhibition to %TPO inhibition C, D, and E) finding show when percent TPO inhibition is applied to serum T4 it provides a good prediction of declines in serum T4 compared in the 14-day dosed group compared with the 4 and 7-day dosed groups. Error bars represent ± SEM.