
FIG 3.
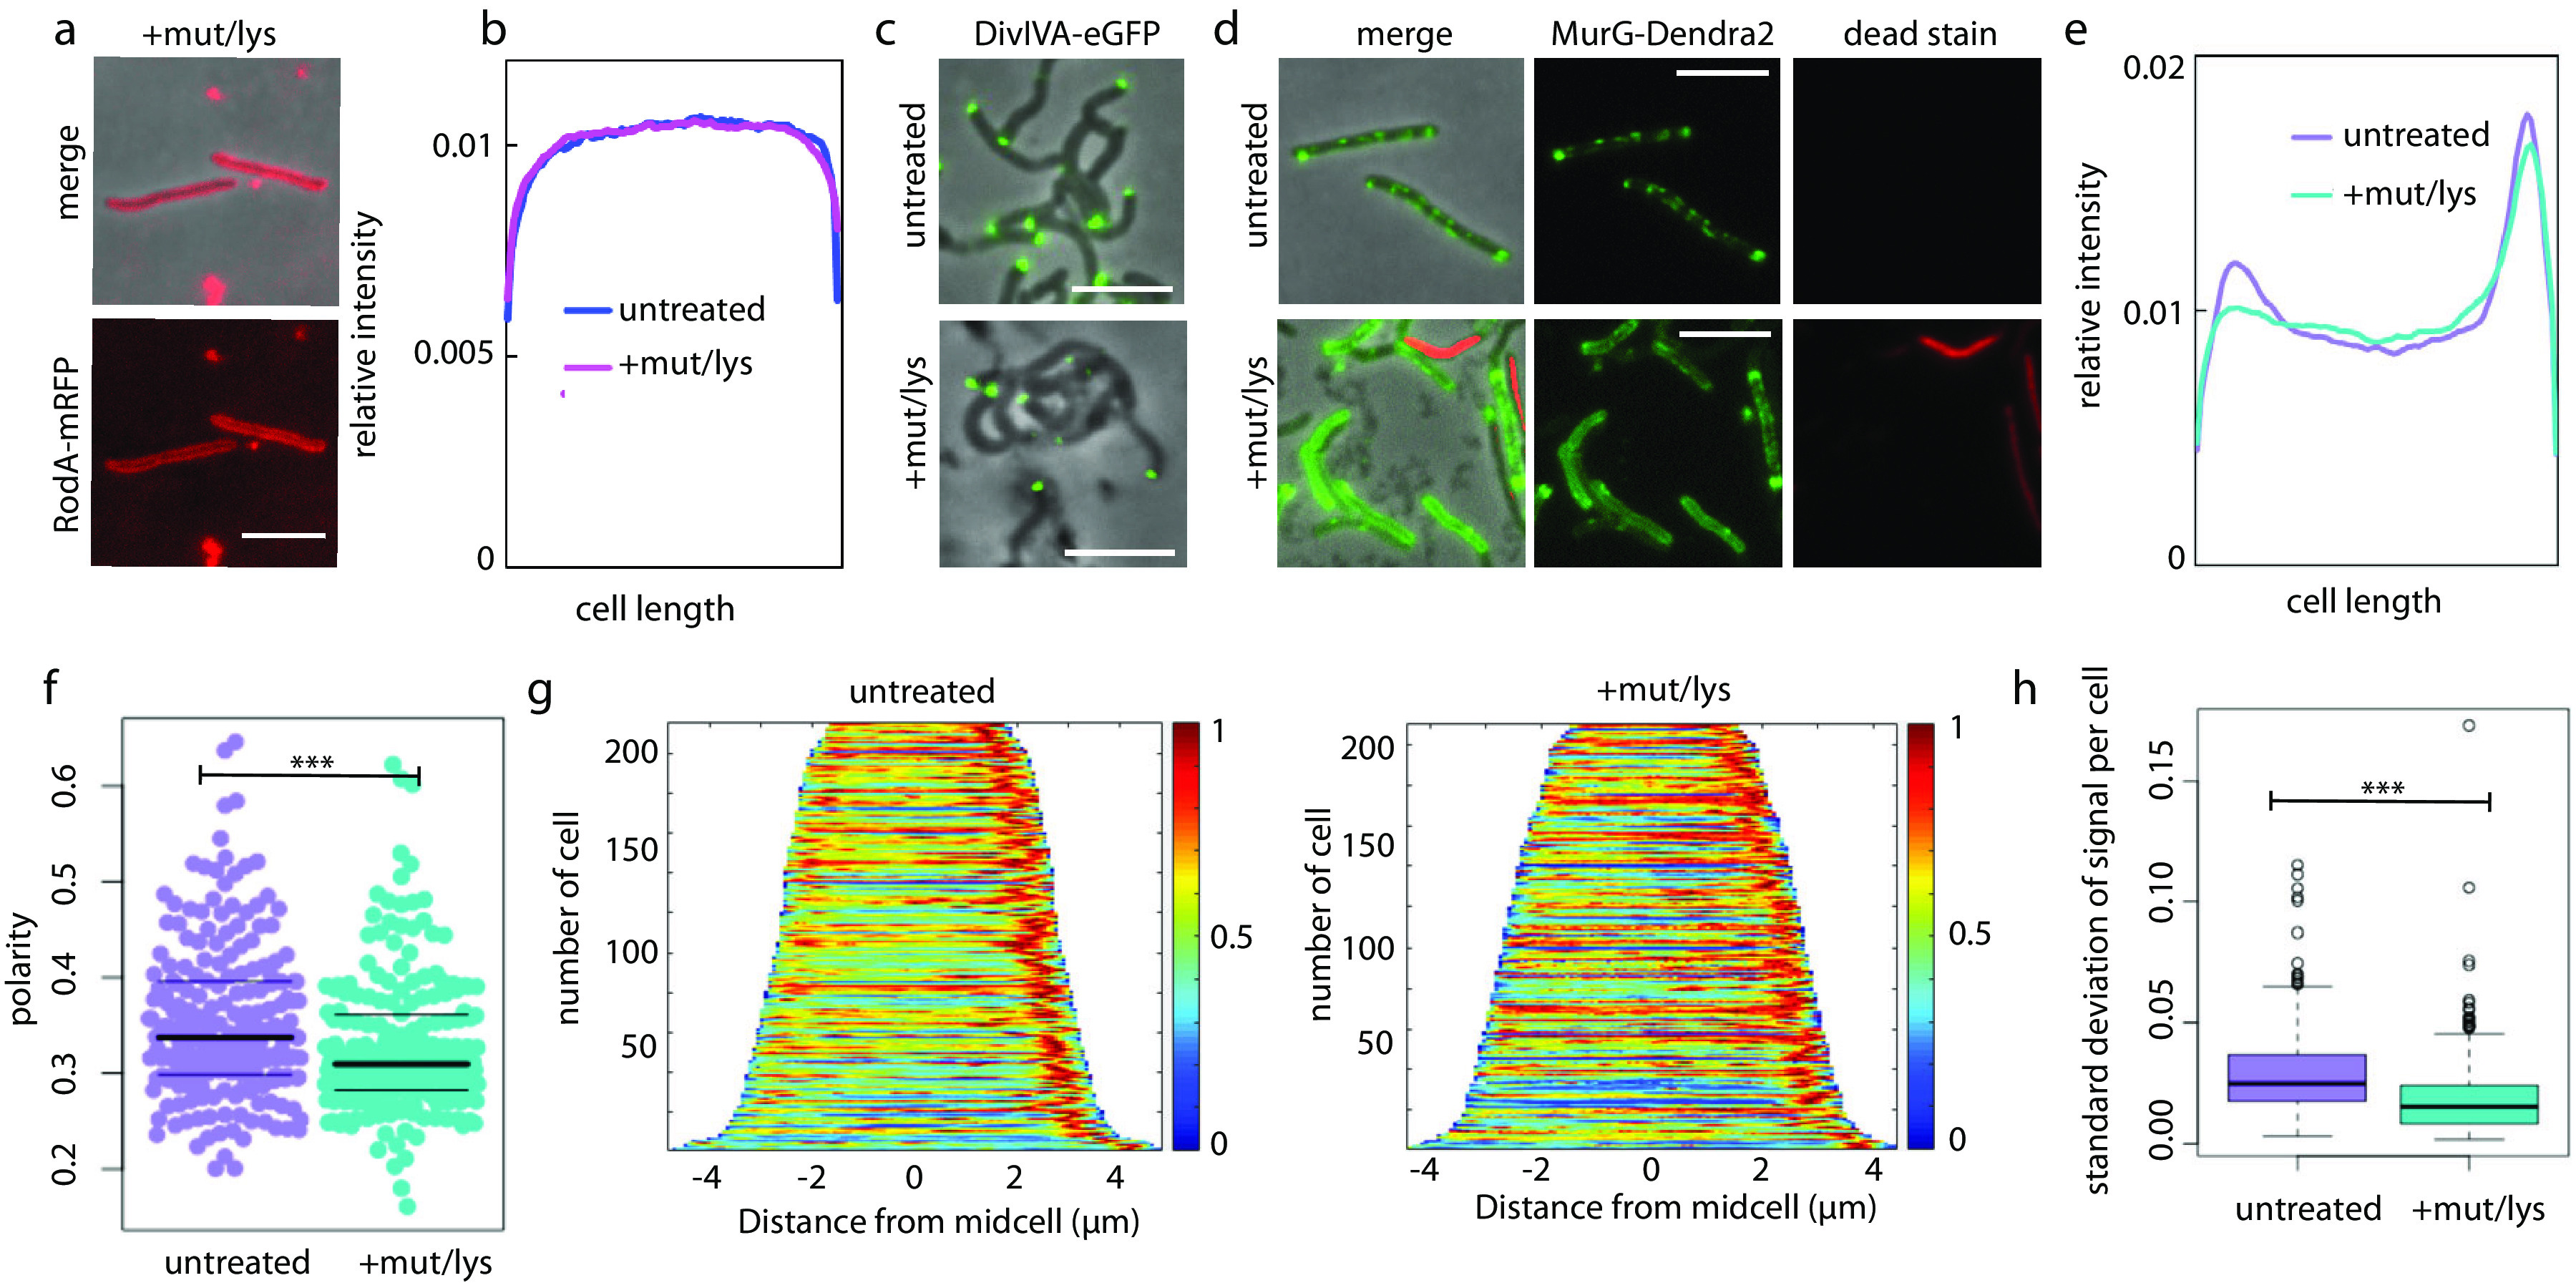
MurG relocalizes upon cell wall damage. (a) RodA-mRFP remains cell-wide in viable cells treated with mutanolysin/lysozyme. Scale bars, 5 μm. (b) Mean fluorescence intensity profiles of RodA-mRFP were generated as described in the legend to Fig. 1. Cells expressing RodA-mRFP were treated with or without mutanolysin/lysozyme and then stained with SYTOX green. Only cells that did not stain green, i.e., were deemed viable, were included in Oufti followed by MATLAB analysis. 58 < n < 116. (c) Cells expressing the DivIVA-eGFP (52) were treated with or without mutanolysin/lysozyme. Scale bars, 5 μm. (d) Cells expressing the functional fusion MurG-Dendra2 (45) were treated with or without mutanolysin/lysozyme and then stained with propidium iodide for detection of dead cells. Three-second exposure for the green channel; 500-ms exposure for the red channel. Scale bars, 5 μm. (e) Normalized MurG-Dendra2 mean fluorescence intensity profiles. (f) Polarity ratio of MurG-Dendra2 signal. t test, P < 0.001. (g) MurG-Dendra2 demographs. (h) Standard deviation calculated for 100 fluorescence values per cell in untreated and treated cells. t test, P < 0.001. 210 < n < 215 (number of cells analyzed).