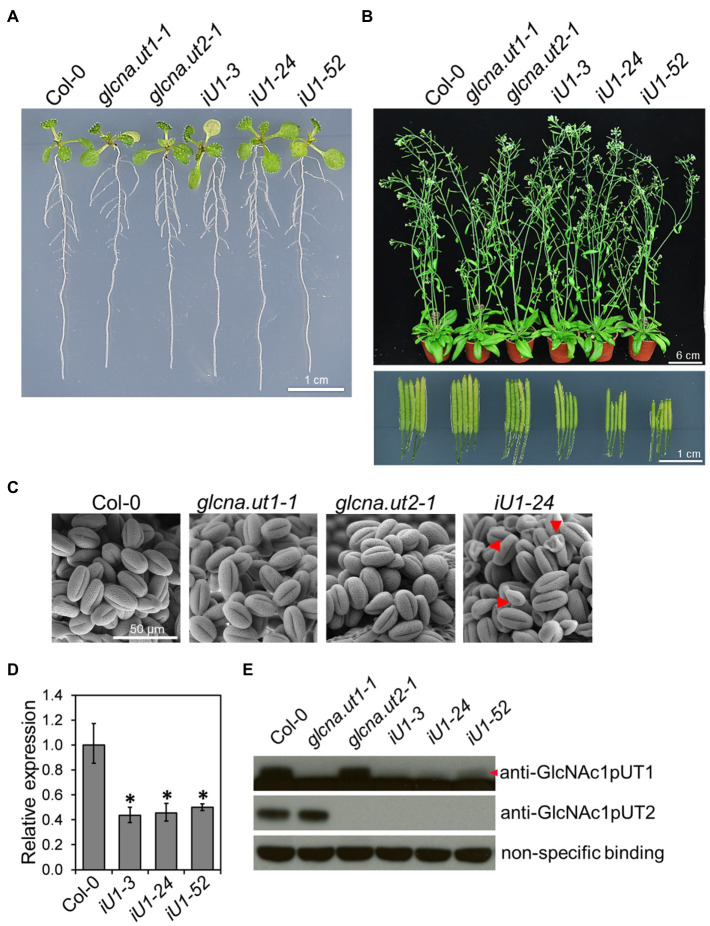
Figure 1.
Phenotypic and molecular analyses of glcna.ut single mutants and iU1 transgenic plants. (A) Seedling phenotype comparison. Seedlings were grown on MS medium for 10 days. iU1 lines represent dsRNAi interference of GlcNA.UT1 in the glcna.ut2-1 mutant background. (B) Comparison of the plant phenotype and silique length. Plants were grown in soil for 37 days. (C) Pollen morphology. Pollen grains were derived from the plants shown in (B) and visualized by scanning electron microscopy. Shrunken pollens are indicated by red arrowheads. (D,E) Expression of GlcNA.UT1. Seedlings grown in MS medium for 14 days were used for total RNA or protein extraction, followed by RT-qPCR (D) and Western blot (E) analyses. The values in (D) represent the means ± SD of four biological replicates, each with technical triplicates. *p < 0.01. Student’s t-test. For Western blot analysis, equal amounts of proteins were loaded in each lane and a nonspecific binding band was used as a loading control. GlcNAc1pUT1 proteins are indicated by a red arrowhead.

