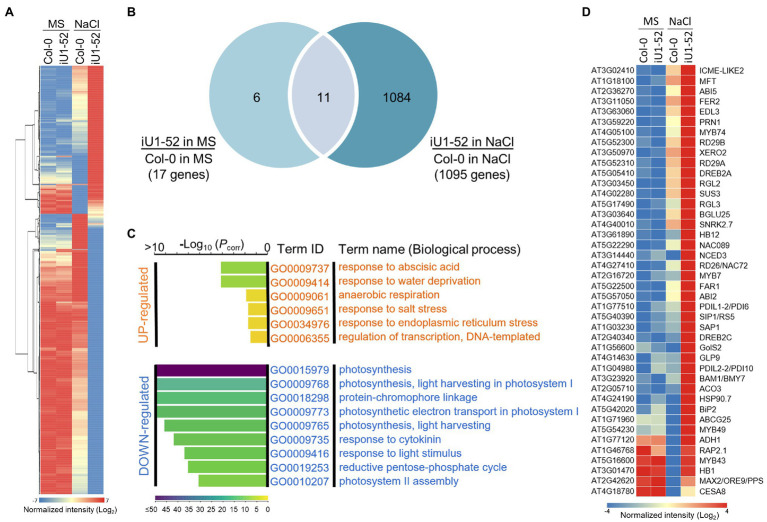
Figure 8.
GlcNA.UT-mediated gene expression profiles. (A) Heatmap of differentially expressed gene (DEG) profile. Total RNA was derived from seedlings grown on agar plates supplemented with or without 200 mM NaCl for 14 days. A total of 1,101 DEG genes derived from the microarray assay were used in this analysis. (B) Venn diagram indicating the overlap of DEG genes between salt and salt-free treatments. (C) Gene ontology (GO) analysis of biological processes. (D) Heatmap showing DEG genes involved in ABA, water deprivation, salt and ER stress responses. For the microarray assay, three biological replicates were performed, and the raw data are available in the Gene Expression Omnibus (GEO) database, with accession No. GSE193841.

