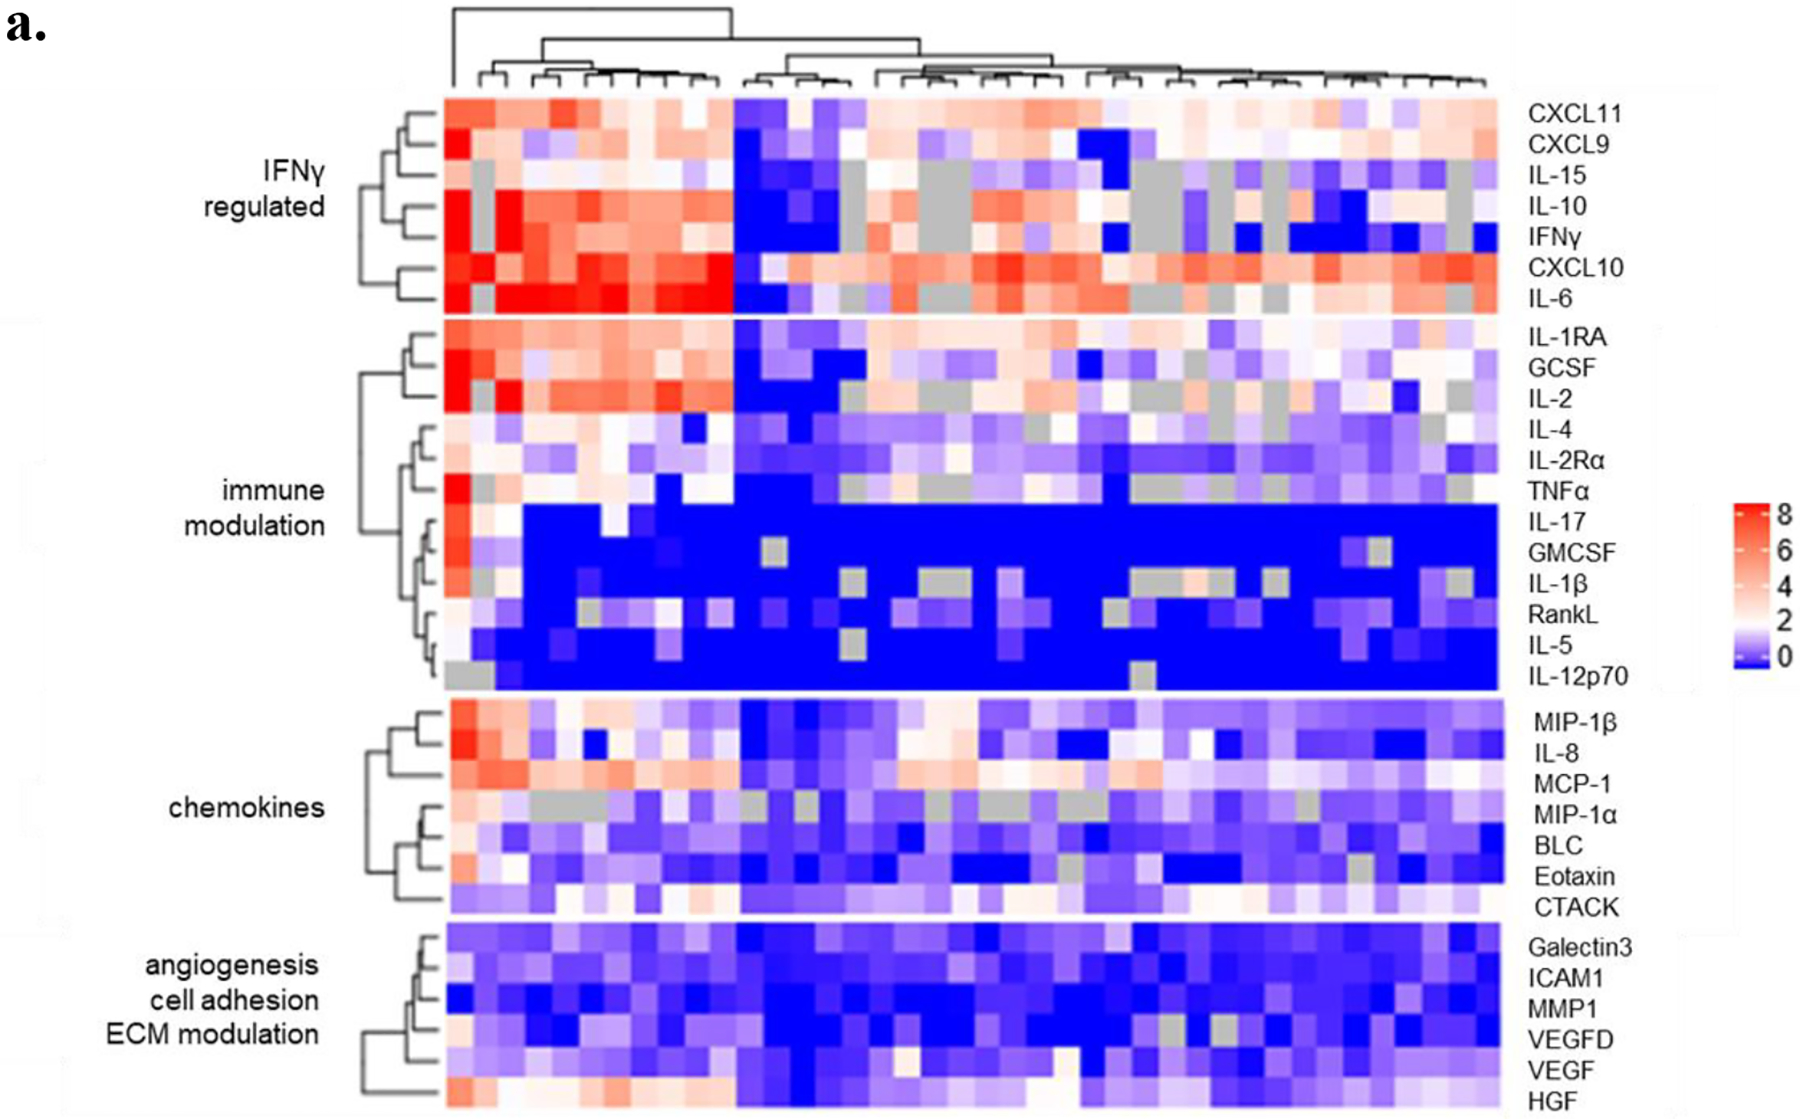
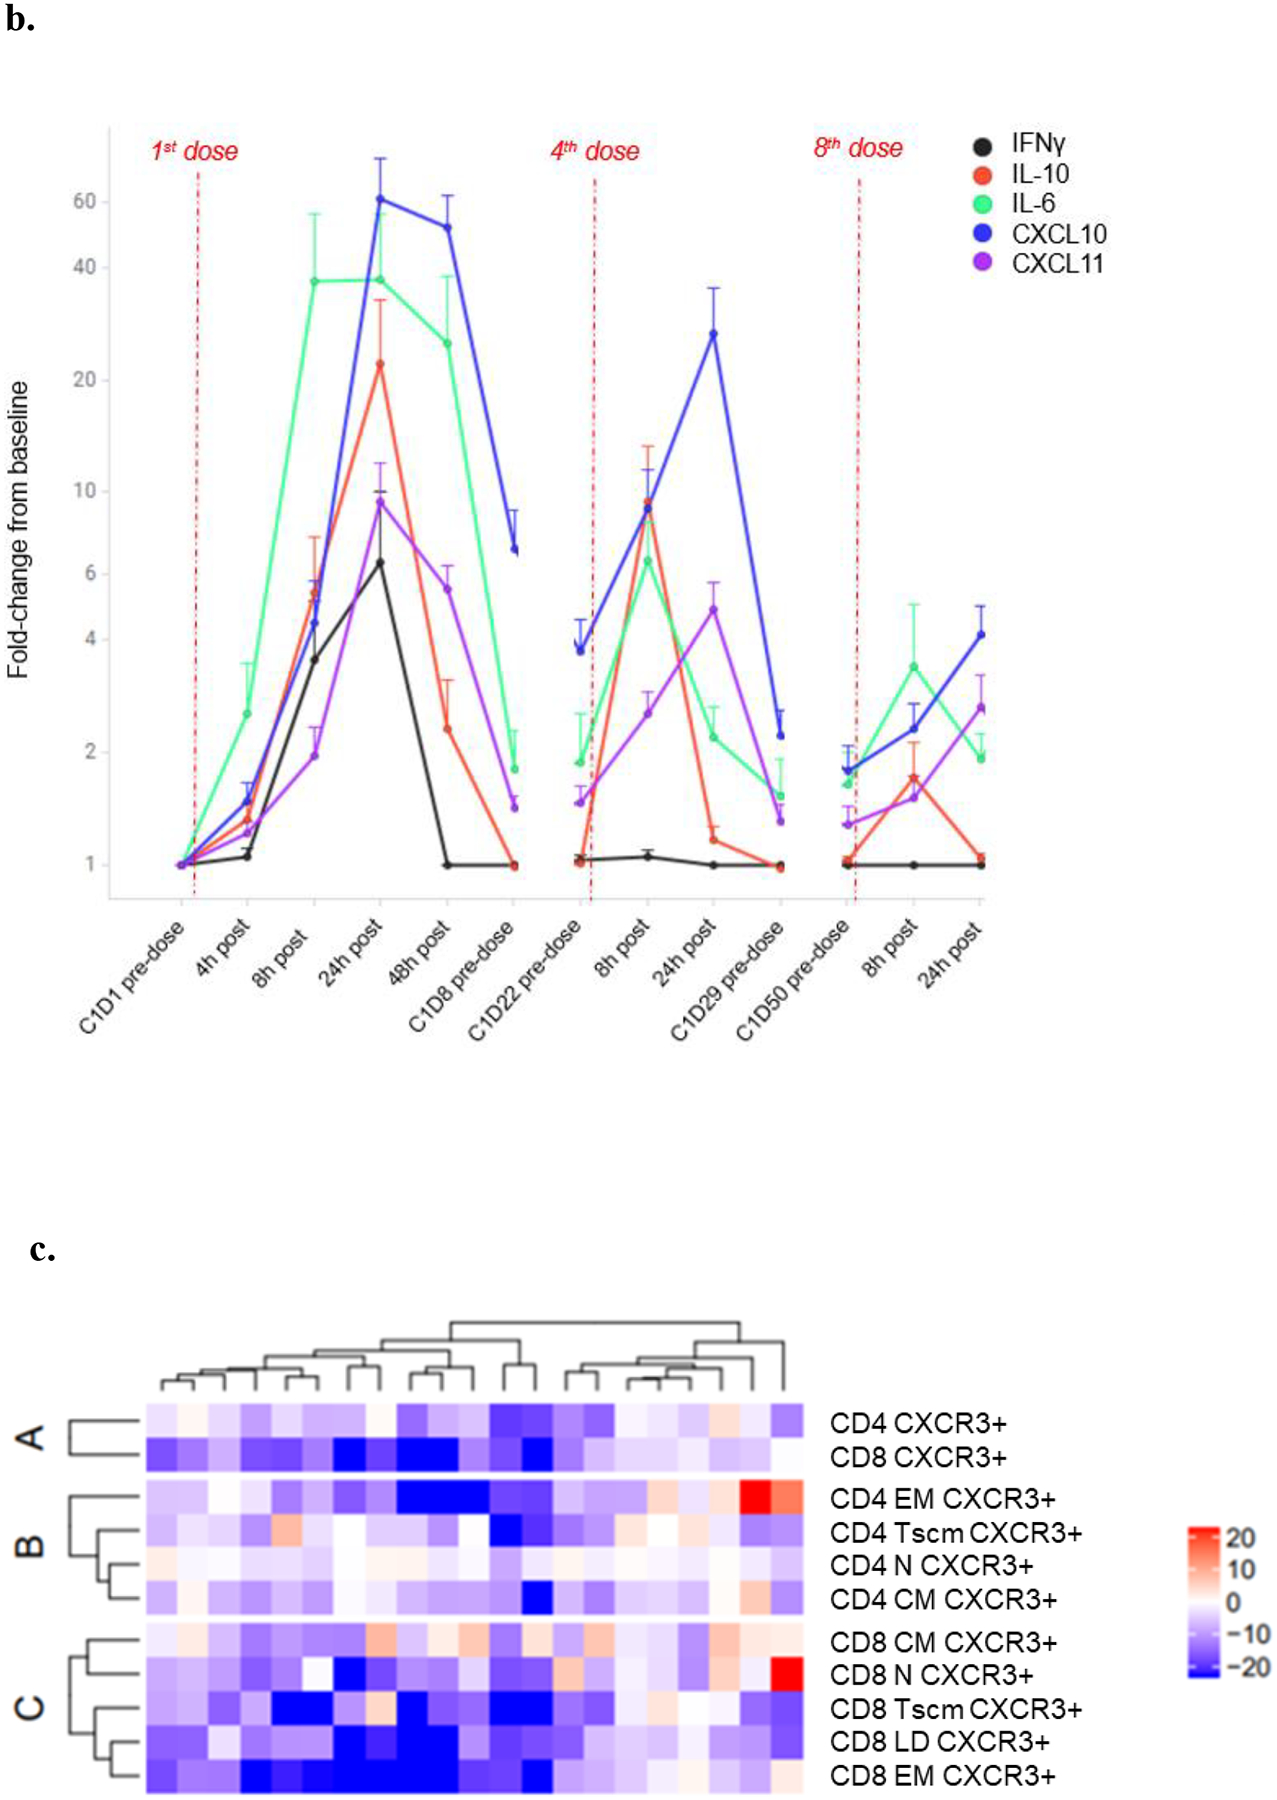
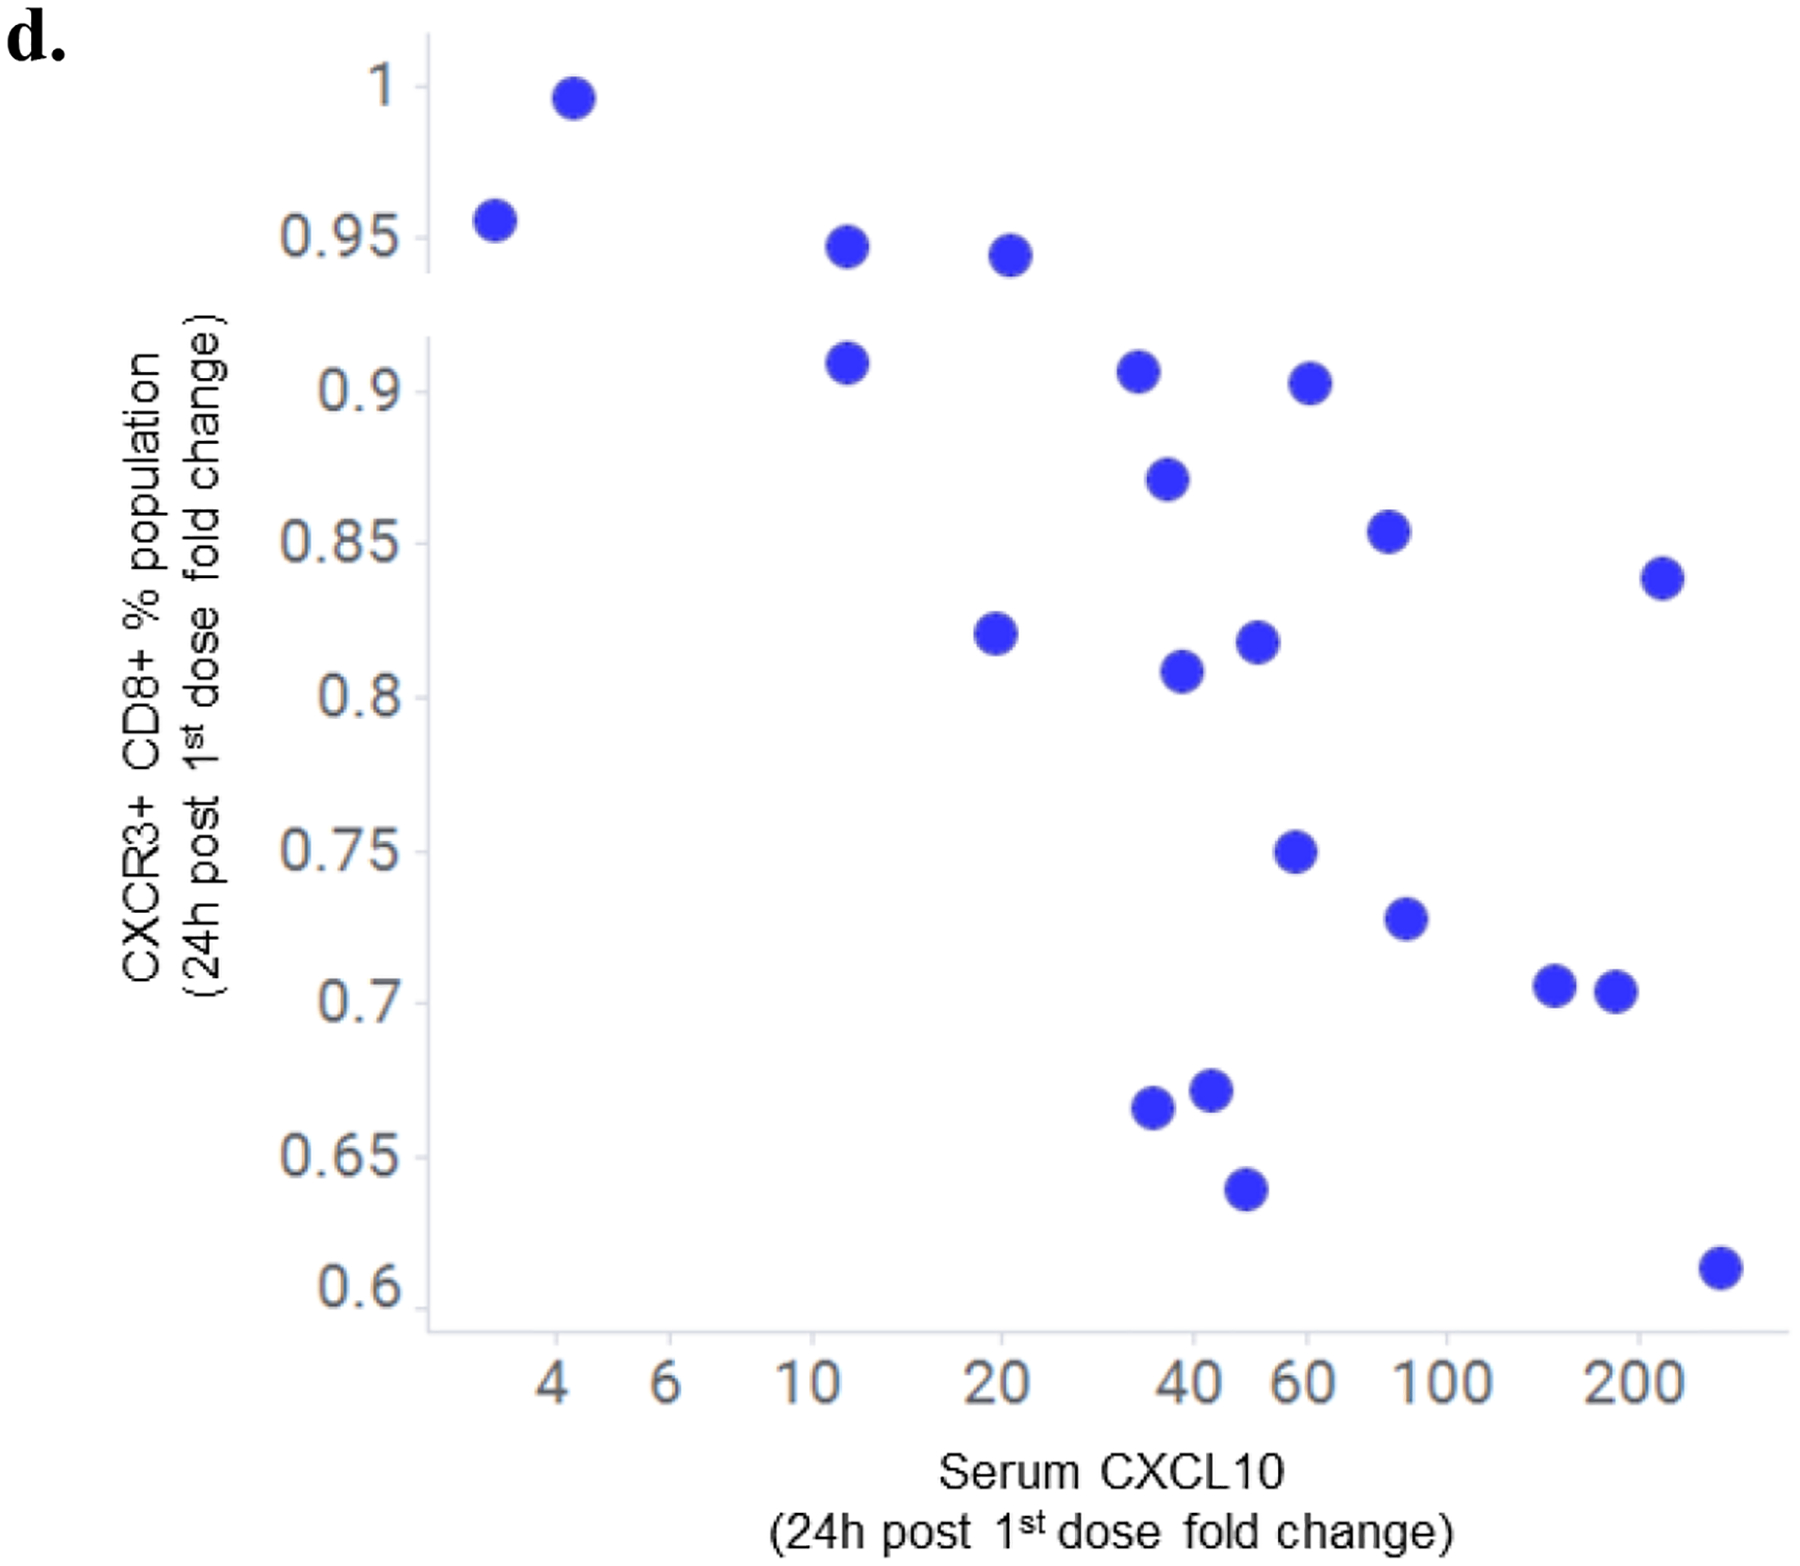
Fig. 2: Tebentafusp induced a pharmacodynamic response in multiple peripheral immune markers.


a. Maximal post-dose (log2) fold-change, relative to baseline concentration, in response to first dose in serum markers in a subset of 40 patients: IL-8, MMP-1, CXCL10, MCP-1, VEGF, BLC, IL-1RA, Galectin 3, MIP-1α, MIP-1β, IL-4, IL-17, GM-CSF, IL-2 Rα, RANK L, CXCL9, IL-5, G-CSF, IL-12 p70, ICAM-1, CXCL11, HGF, VEGF-D, CTACK, Eotaxin (n=40); IFNγ, TNFα, IL-1β, IL-2, IL-6, IL-10 and IL-15 (n=31/40). (ECM, extracellular matrix).
b. Temporal profile of post 1st, 4th and 8th dose fold-change response in IFNγ ( ), IL-10 (
 ), IL-6 (
 ), CXCL10 (
 ) and CXCL11 (
 ) in a subset of 15 patients treated weekly with 600 ng/kg/ 50 mcg tebentafusp. Plots represents mean ± standard error of the mean [SEM]
c. Percentage differences in CXCR3+ CD4+ and CD8+ parent populations (A), CD4+ subsets (B) and CD8+ subsets (C) at ~24 h post 1st dose tebentafusp compared with baseline. Heatmaps constructed using the ComplexHeatmap R library(13). N, naïve; EM, effector memory; CM, central memory; Tscm, stem-cell memory T cell; and LD, late differentiated effector memory.
d. Correlation of fold increase in serum CXCL10 with fold decrease in peripheral CXCR3+ CD8+ cell population 24 h following first dose of tebentafusp (Spearman R= −0.66; p=0.00104; n=21).
