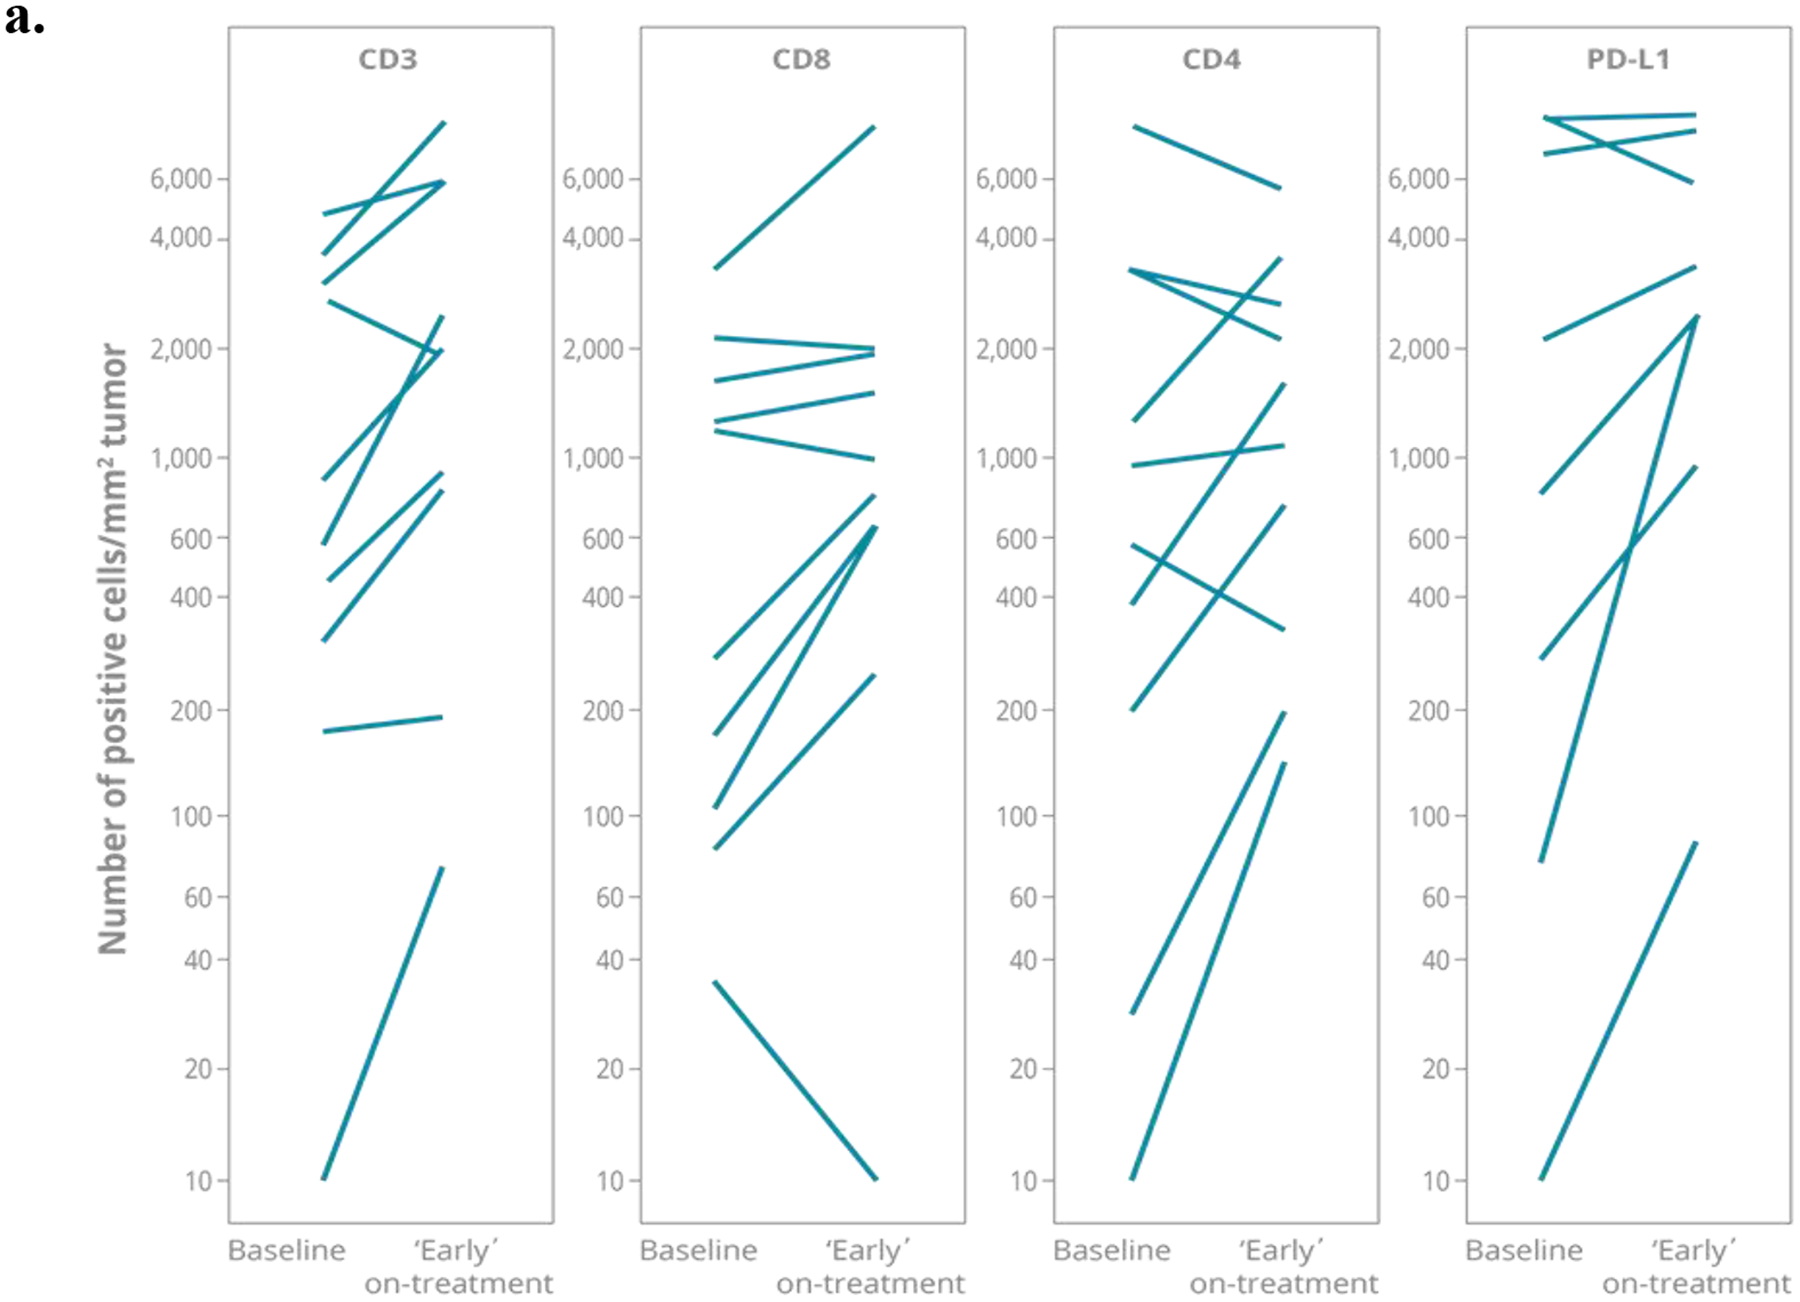
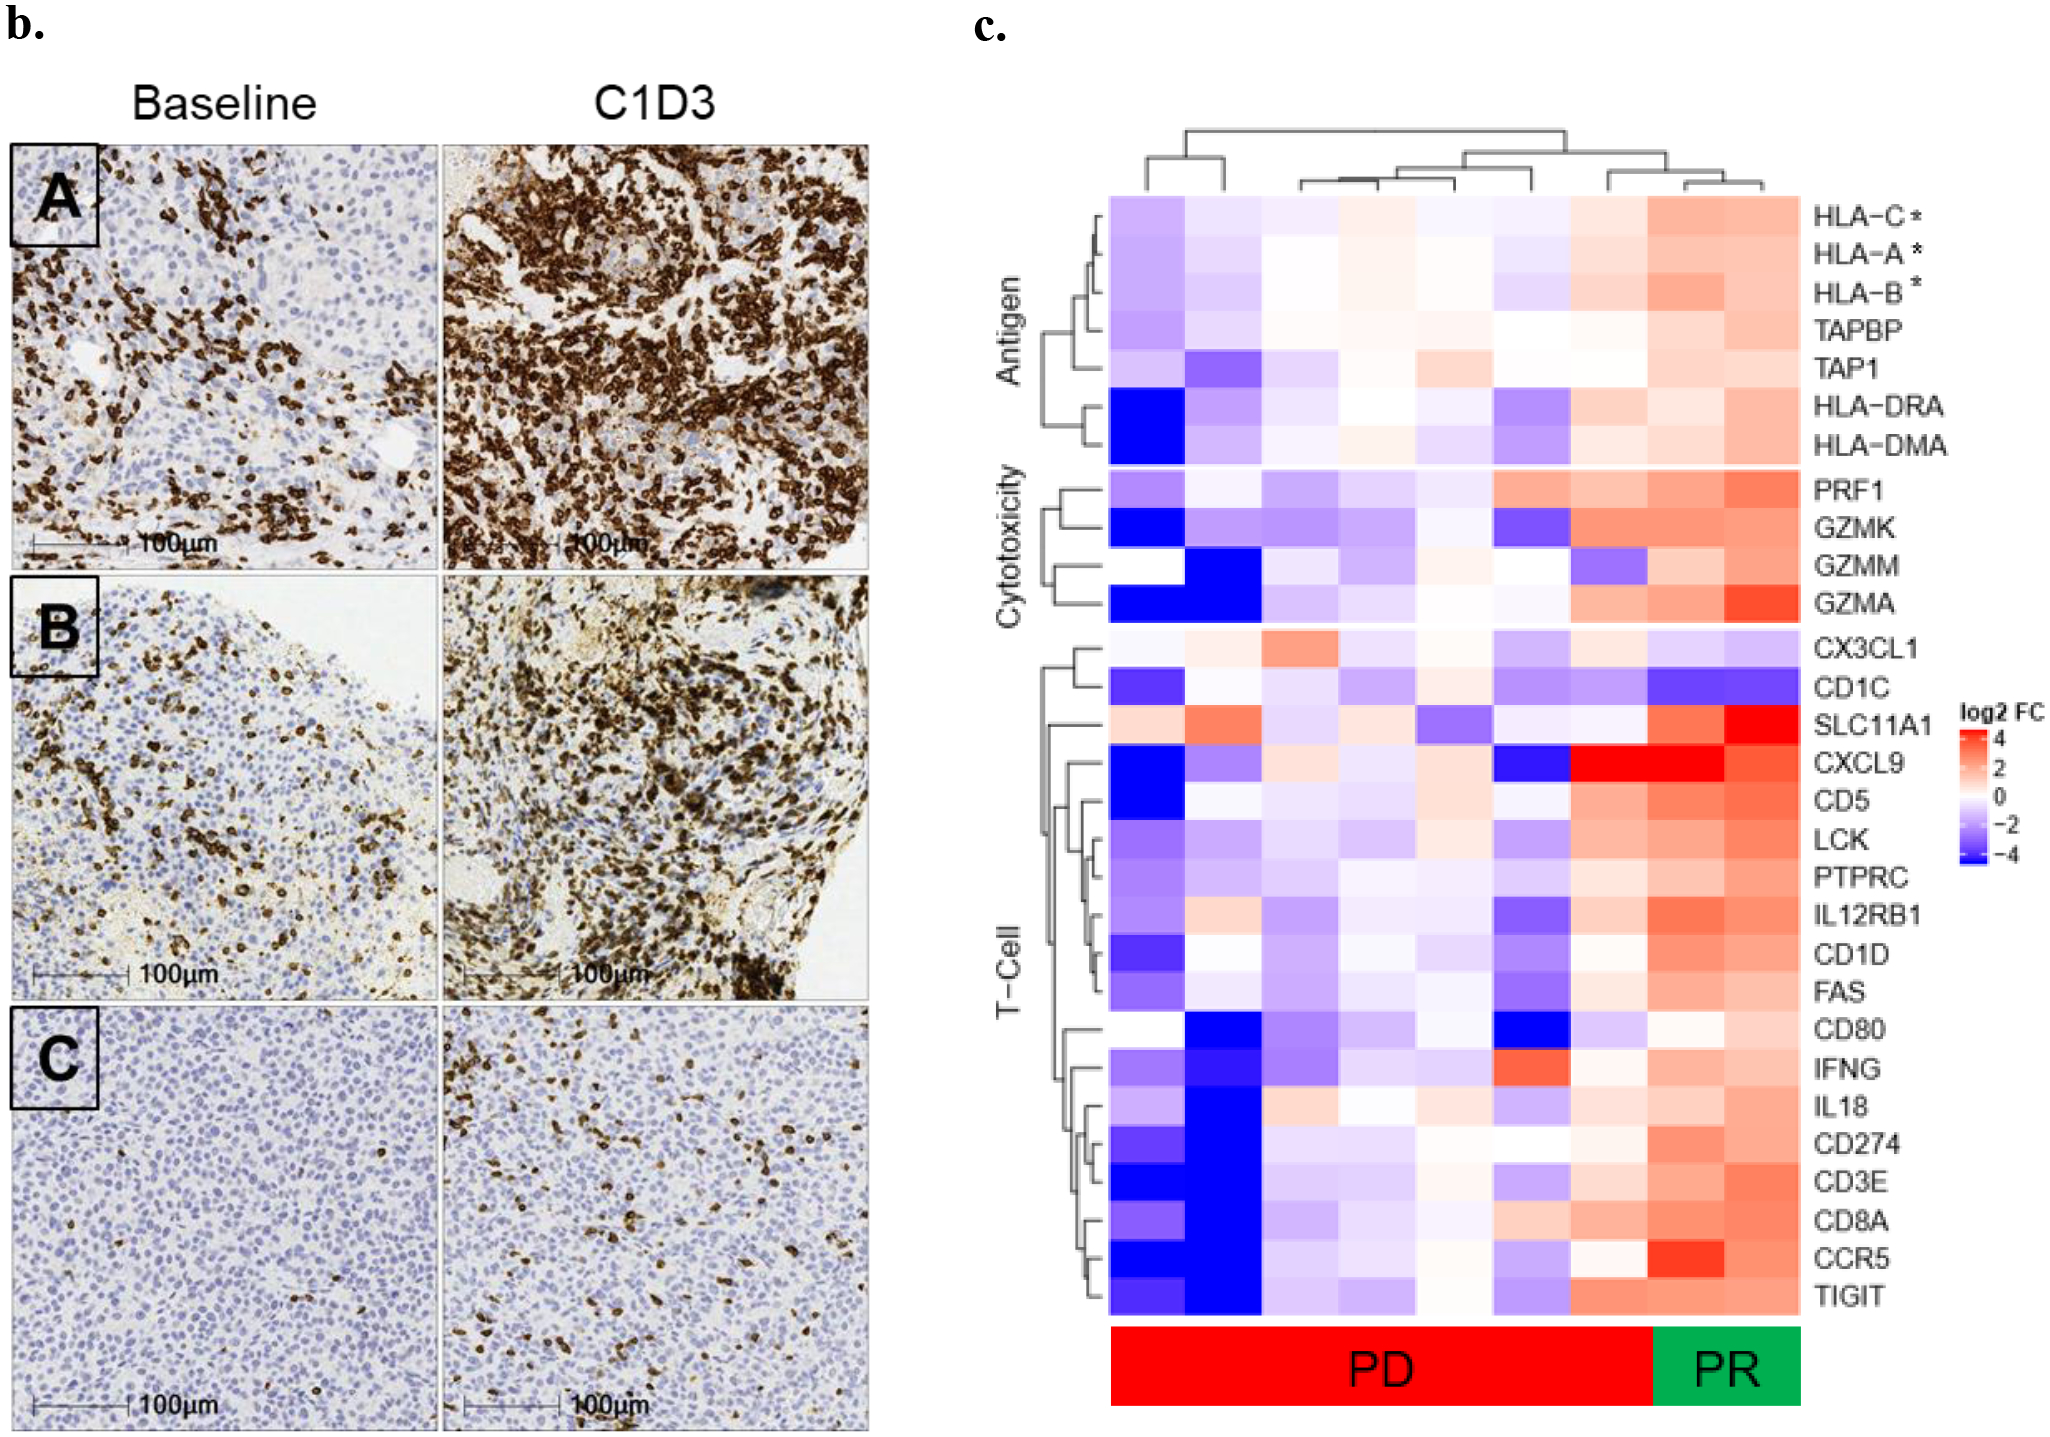
Fig. 3: Increased presence of T cells observed in on-treatment tumors.


Image analysis quantified the expression of CD3+, CD4+, or CD8+ T cells together with PD-L1 expression. (a) Number of CD3+, CD8+, CD4+ and PD-L1+ cells/ mm2 tumor in paired baseline and early on-treatment biopsies (taken Cycle 1 Day 3–17) from up to 11 patients; line per patient. (b) Example immunohistochemistry (IHC) images of CD3+ staining in baseline and on-treatment (C1D3) biopsies from three patients: non-uveal Patient A (Rectus abdominal muscle) and B (L abdomen); uveal Patient C (abdominal wall). (c) Heatmap representation of genes identified from enrichment analysis with significantly different expression in on-treatment tumor biopsy (taken Cycle 1 Day 3–17) relative to baseline sample from partial response compared with progressive disease patients. These genes belonged to NanoString categories ‘Antigen processing’, ‘Cytotoxicity’ or ‘T cell function’ (*HLA-C, -A, -B also in Antigen Processing and Cytotoxicity category). Data scale represents log2 fold-change relative to associated baseline.
