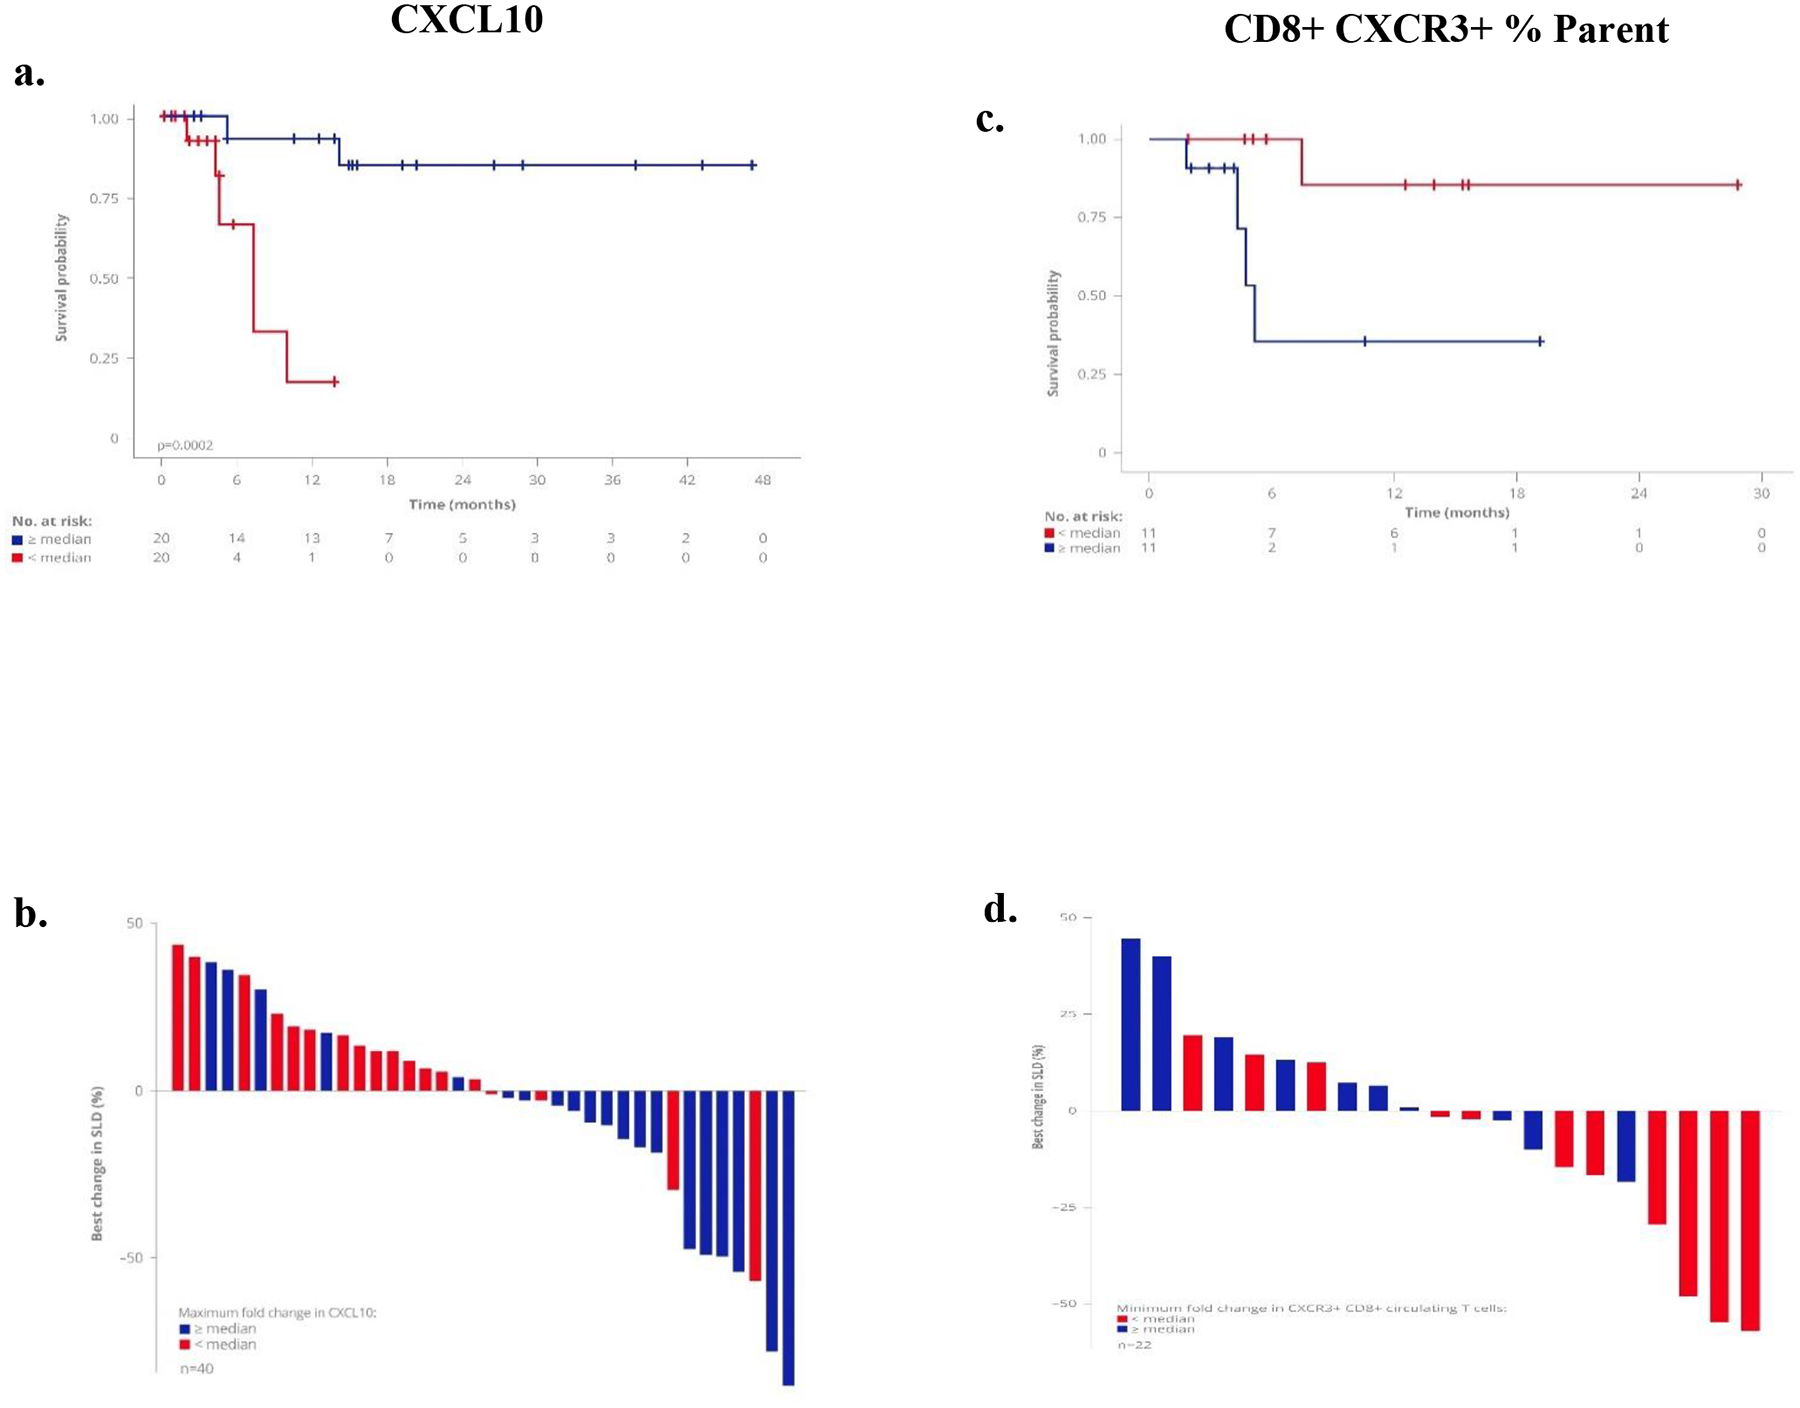
Fig. 4: On-treatment biomarkers associated with clinical response.

A greater maximal fold increase in serum CXCL10 level, and maximal fold decrease in circulating CXCR3+ CD8+ T cell population in response to first dose of tebentafusp, was associated with longer OS and tumour shrinkage. Kaplan–Meier survival of patients by: (a) serum CXCL10 (n=40, p=0.00019) and (c) CXCR3+ CD8+ T cell population (n=22, p=0.0086); both ≥median vs <median.
Waterfall plots depicting the maximum % reduction in the sum of longest diameters (SLD) of target tumor measurements from baseline for change in (b) serum CXCL10 (Fisher’s Exact test, p=0.0029) and (d) CXCR3+ CD8+ T cells (Fisher’s Exact test, p=0.03), both ≥median vs <median.
