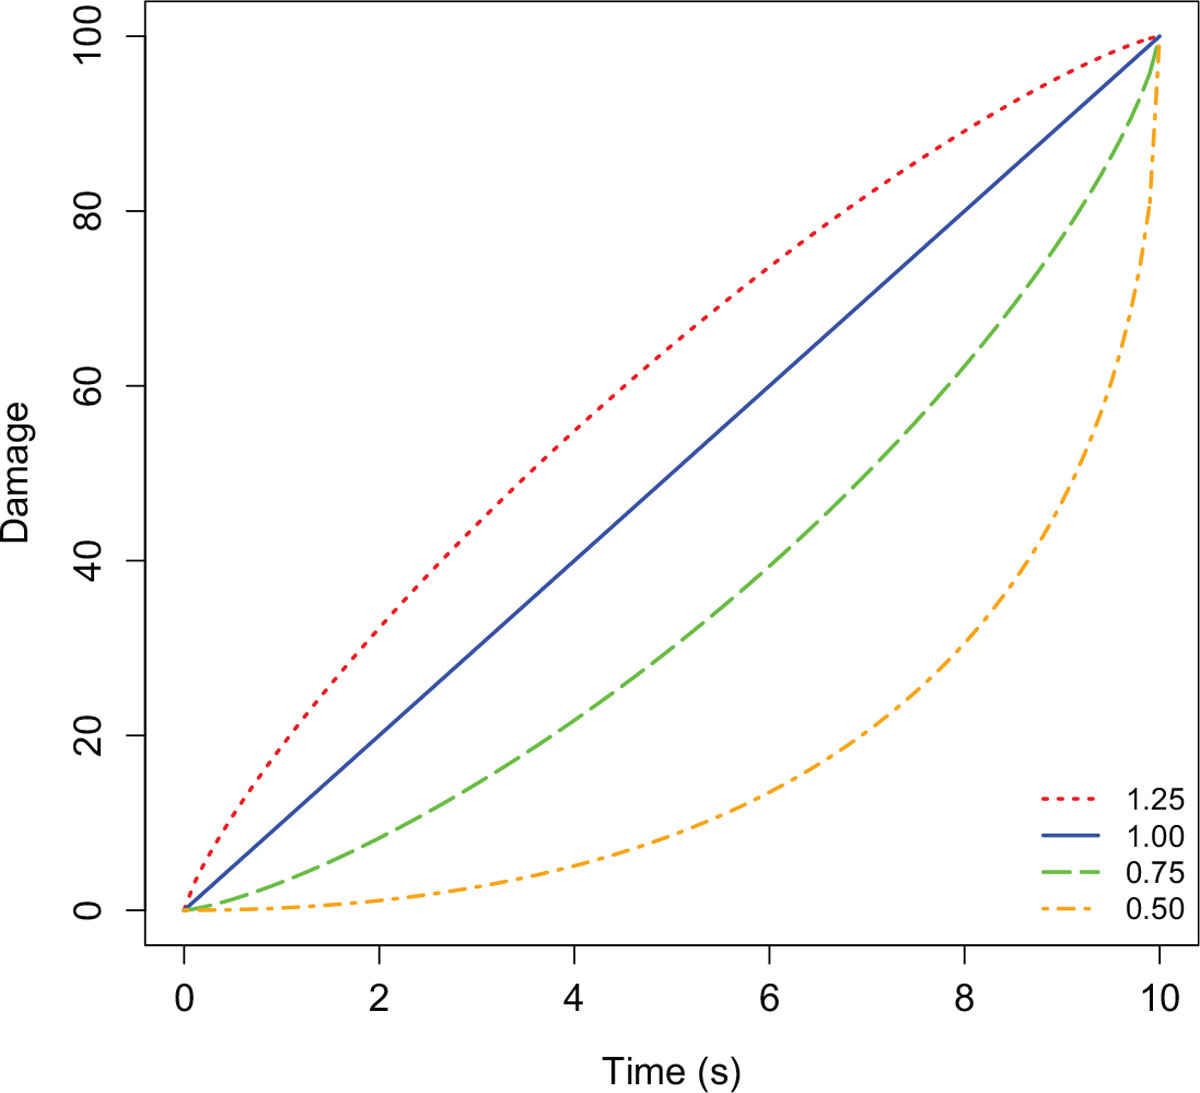
Fig. 1.

Currently available damage as a function of time waited since the last shot fired. In this graph, the maximum damage is accumulated after waiting 10 s since the previous shot. The curves illustrate the rate of damage accumulation according to four different values of power, as indicated in the legend.
