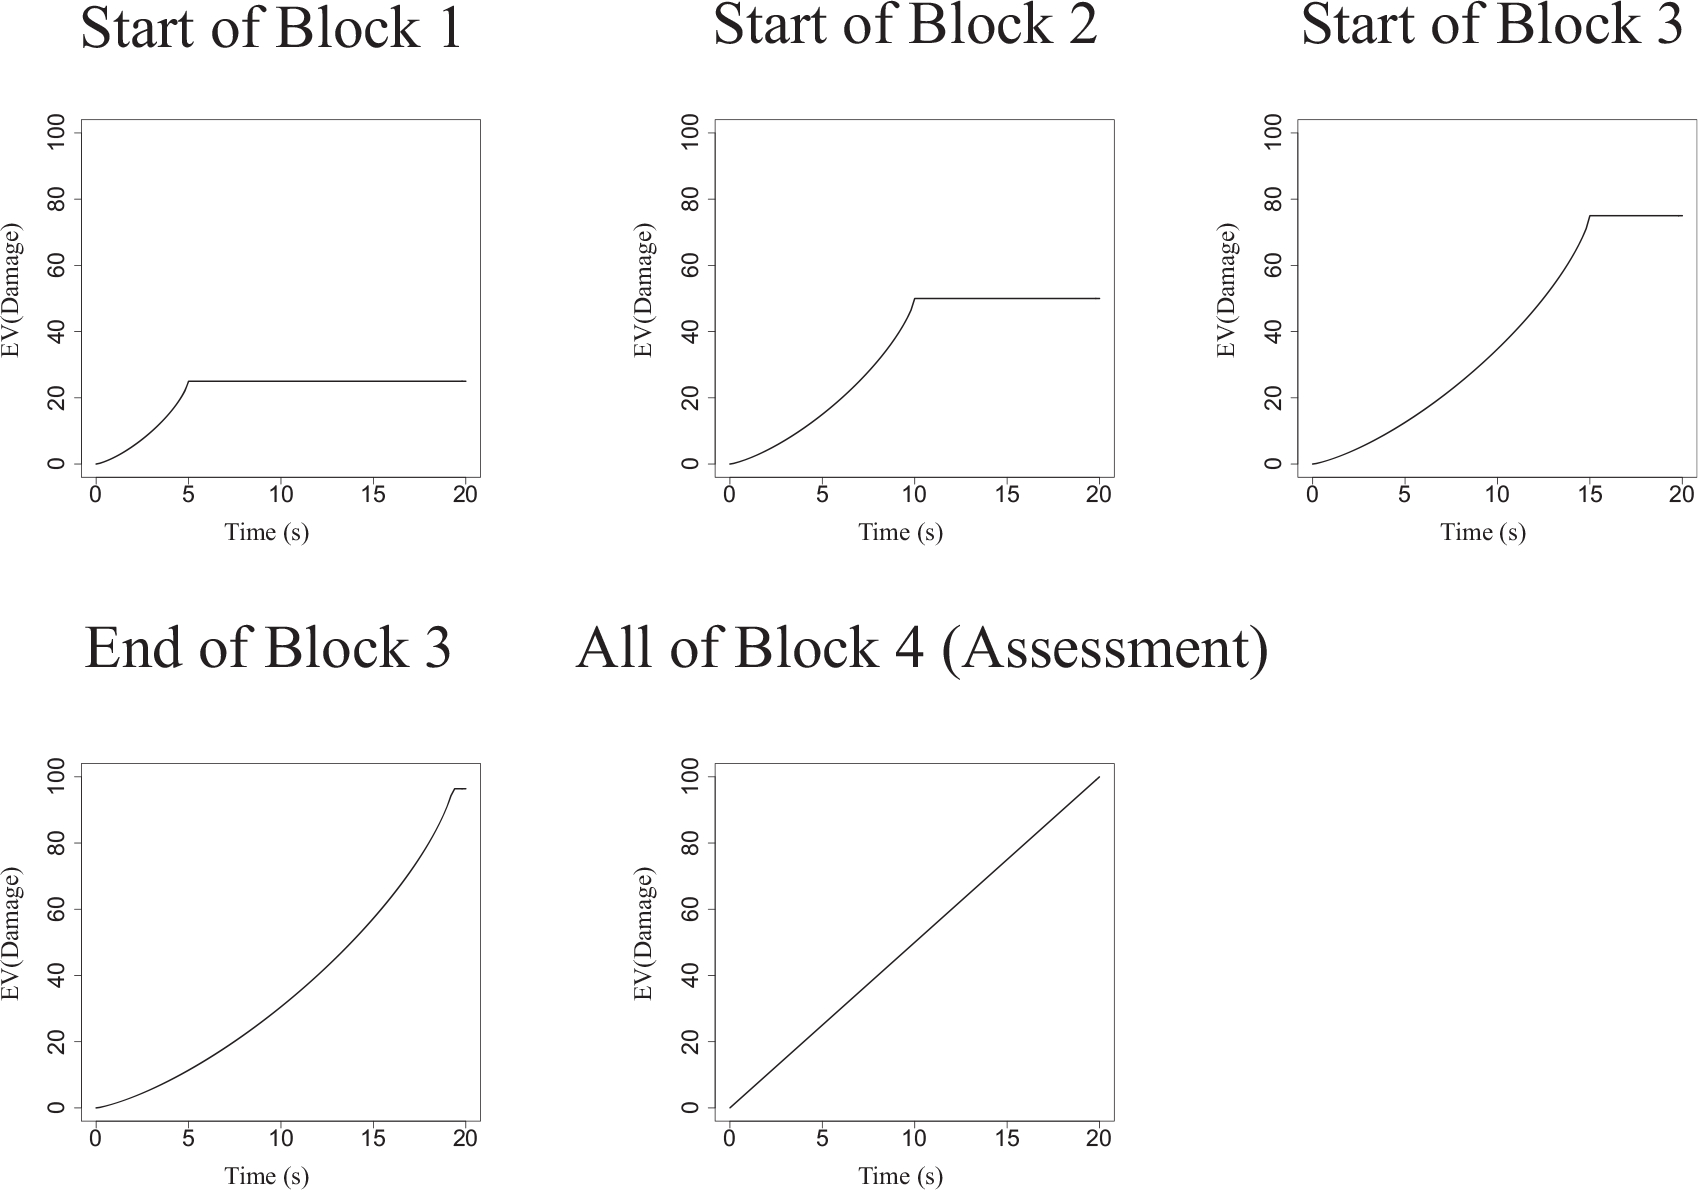
Fig. 2.

Snapshots of the programmed increase in magnitude or probability as a function of time waited (depending on condition) throughout the first three blocks of training. The y-axis represents the expected value of damage, which is the product of the probability of a successful shot and the available damage; for the magnitude condition, the expected value is the currently available damage (probability is a constant 100%), and for the probability condition the expected value is the maximum damage times the current probability. In the final block, magnitude increased linearly for both the magnitude and probability conditions while the probability was 100%.
