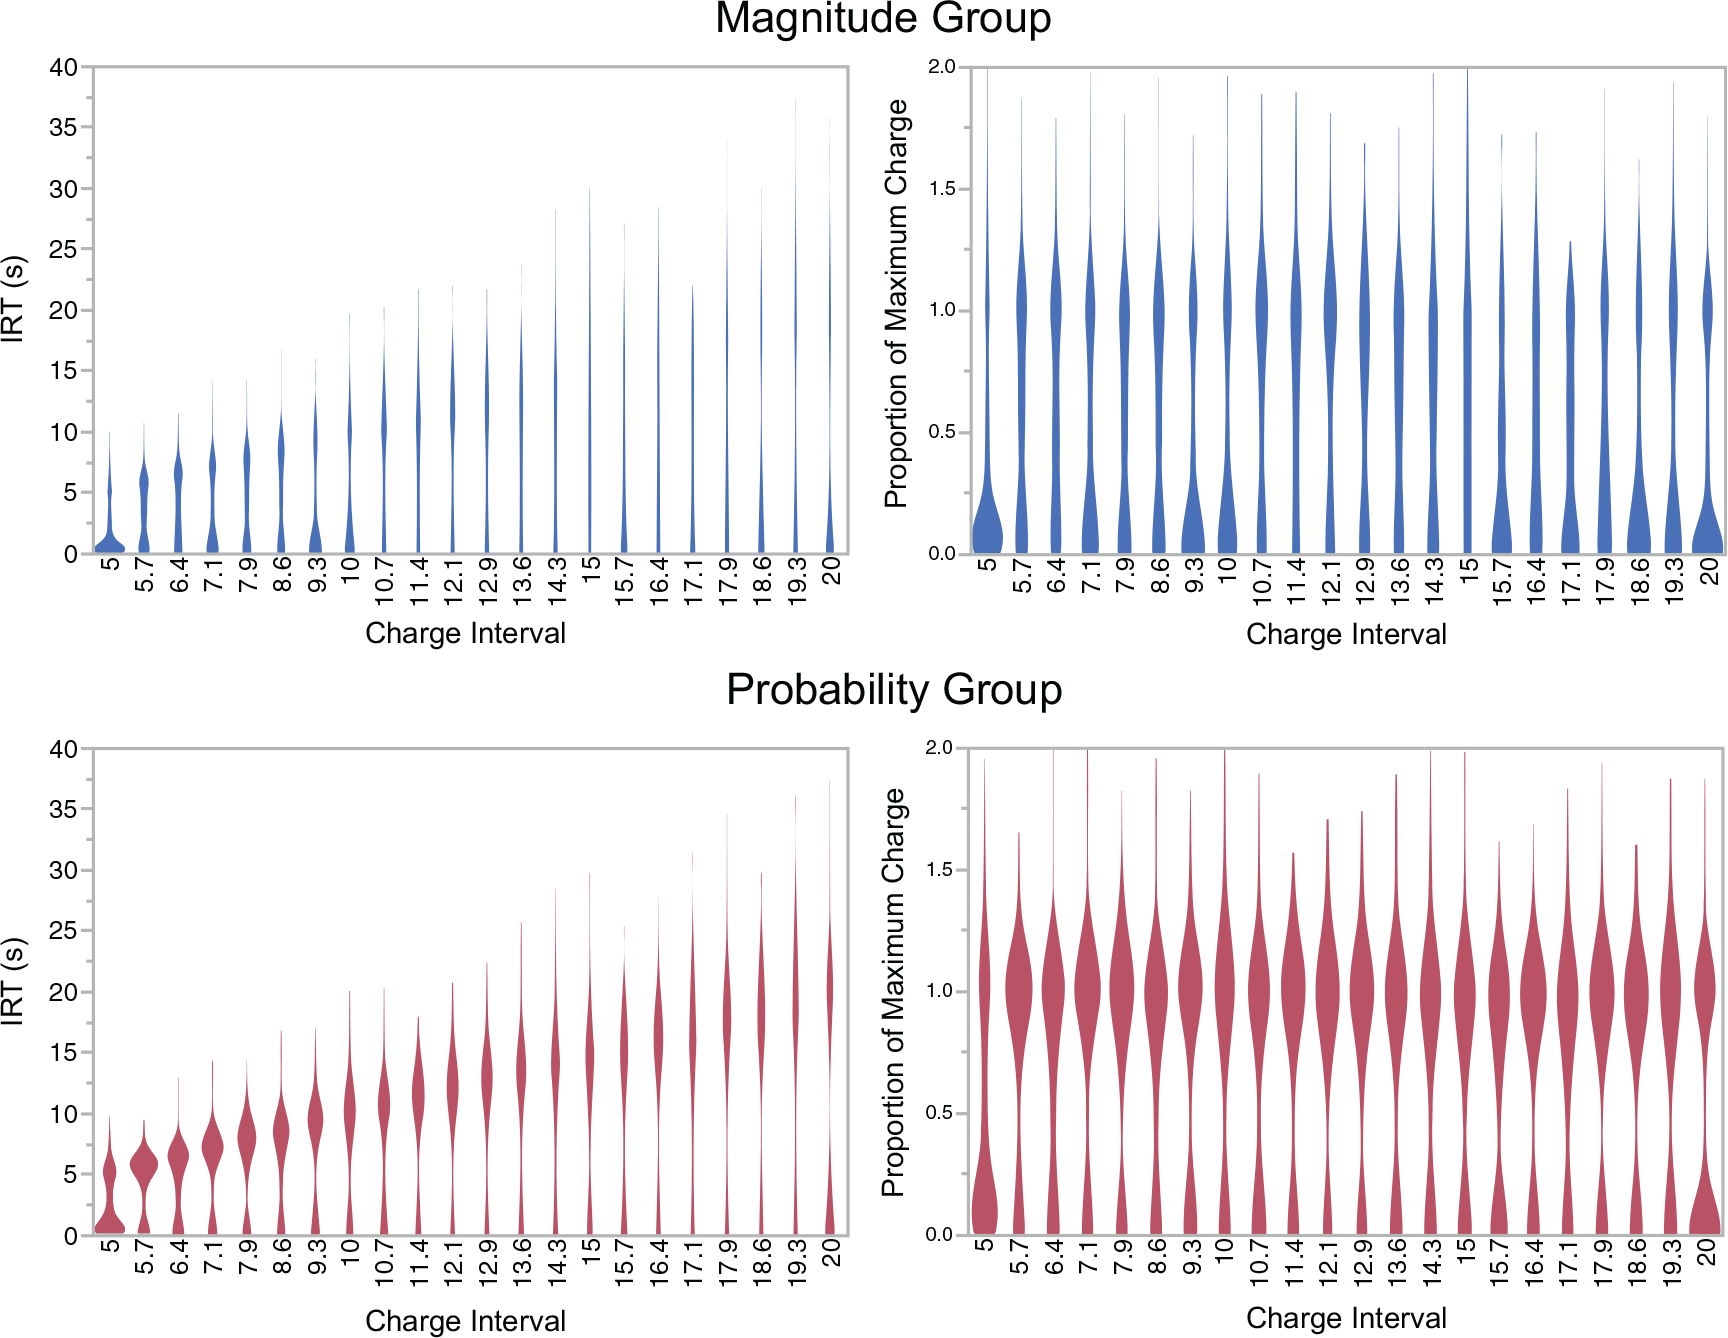
Fig. 3.

Distributions of IRTs (on the left) and IRTs expressed as a proportion of the charge interval (on the right) for each condition. The width of the plot corresponds to the frequency with which that IRT occurred. On the left, the width of the plots decreases as the charge interval increases due to the increases in IRTs (i.e., the elongation of the plot). Note that, for the plots of proportions at a charge interval of 20 s, the proportion of short IRTs appears inflated compared to other plots; this is a by-product of a longer duration of the game played with this particular charge interval compared to others.
