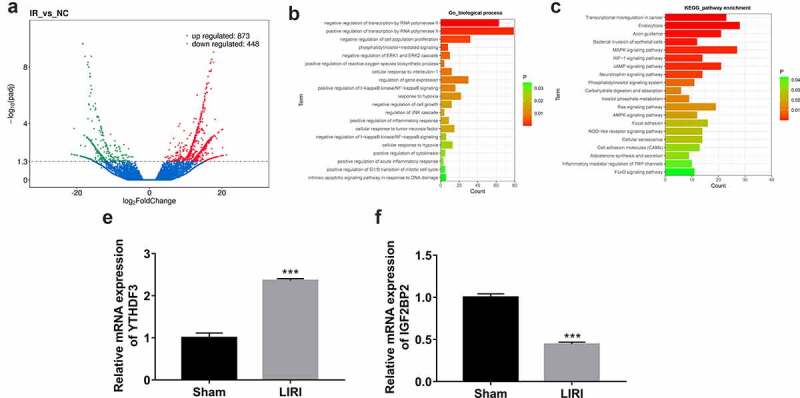
Figure 1.

Identification of differentially expressed genes in lung tissues of LIRI rats versus the sham group. (a) Volcano plots of differentially expressed genes in the LIRI versus sham group. (b) Partial GO enrichment outcomes of differentially expressed genes in the LIRI versus sham group. (c) Partial KEGG enrichment outcomes of differentially expressed genes in the LIRI versus sham group. (d and e) The expression levels of YTHDF3 and IGF2BP2 were determined by RT-qPCR assay.
