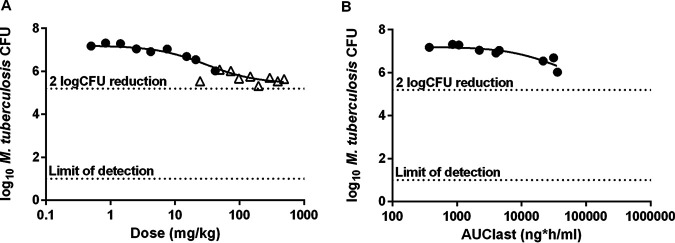
FIG 3.
Lung CFU counts after 8 days of GSK2556286 treatment in an acute infection model in C57BL/6 mice. Data points represent individual mouse results. Open triangles represent mice from an initial experiment with a higher dose range. Solid circles represent mice from a second experiment with a lower, but overlapping, dose range. Solid lines represent fitted sigmoidal dose-response (A) and whole-blood exposure-response (B) curves, where AUClast is the AUC0–24. Horizontal dotted lines show thresholds for a 2-log10 reduction in CFU compared to untreated mice and the lower limit of CFU detection, as indicated.

