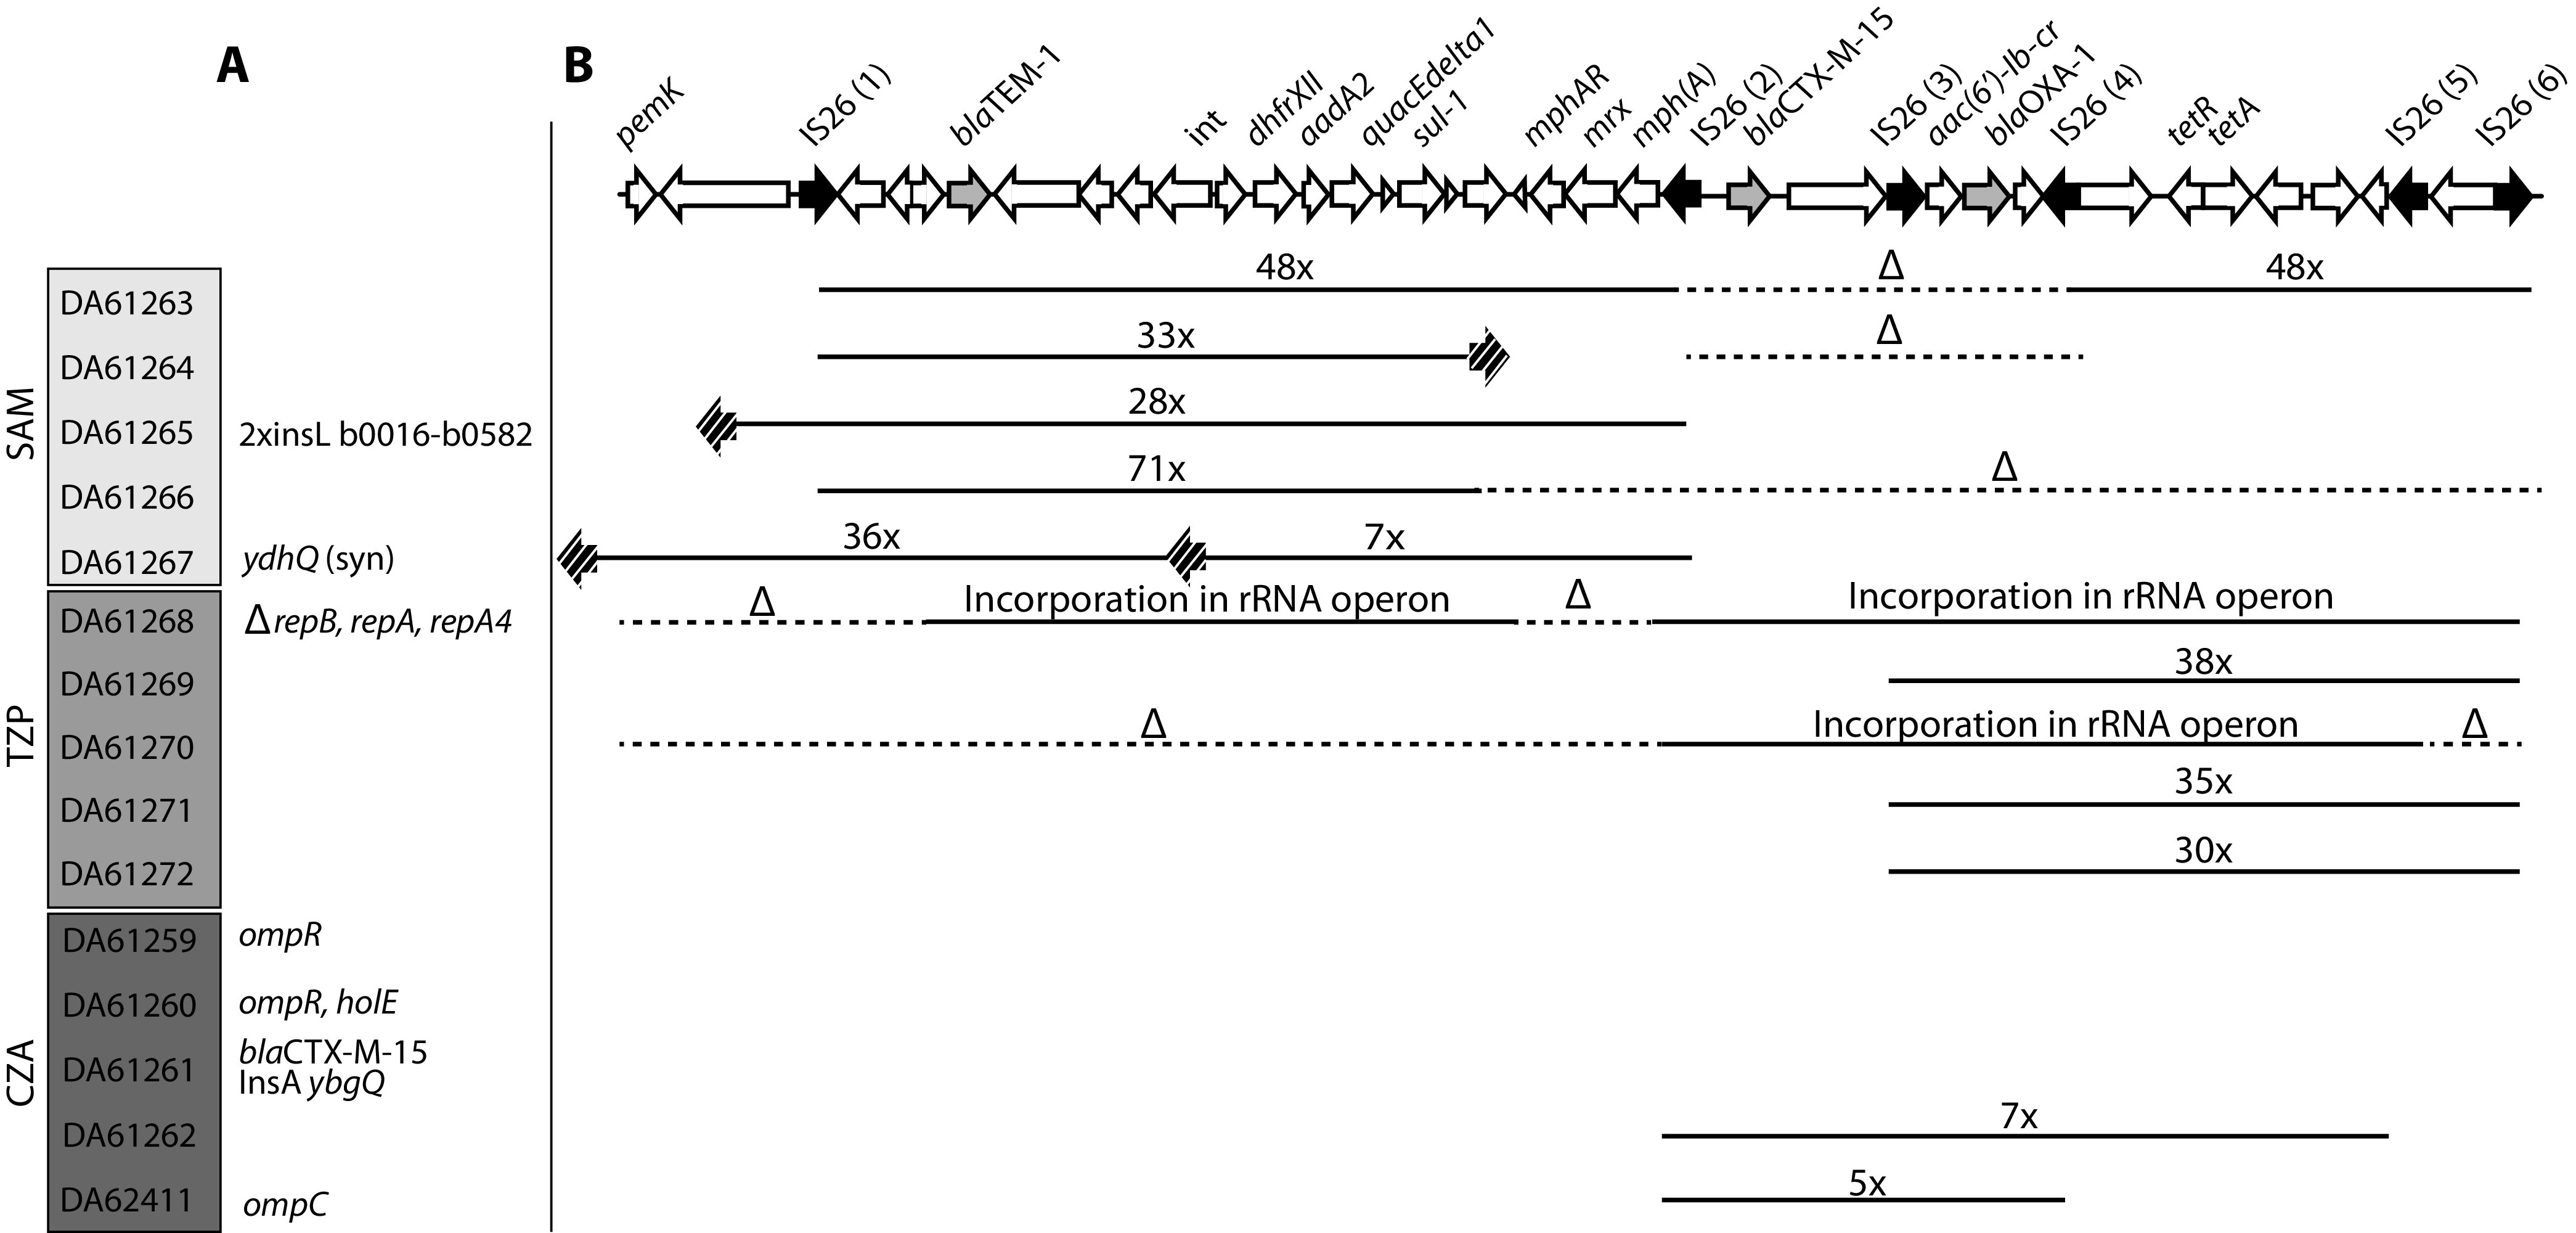
FIG 2.

Genetic changes for one-step mutants. (A) Point mutations and other changes. (B) Deletions and amplifications in the resistance cassette. Black arrows indicate IS26 elements, and gray arrows display the three β-lactamases. Striped arrows indicate additional IS26 insertions. Solid lines display the amplification of a certain region of the cassette, whereas dotted lines with Δ indicate deletions. Numbers indicate the copy numbers of the amplified regions. The exact locations of all genetic changes can be found in Table S3 in the supplemental material.
