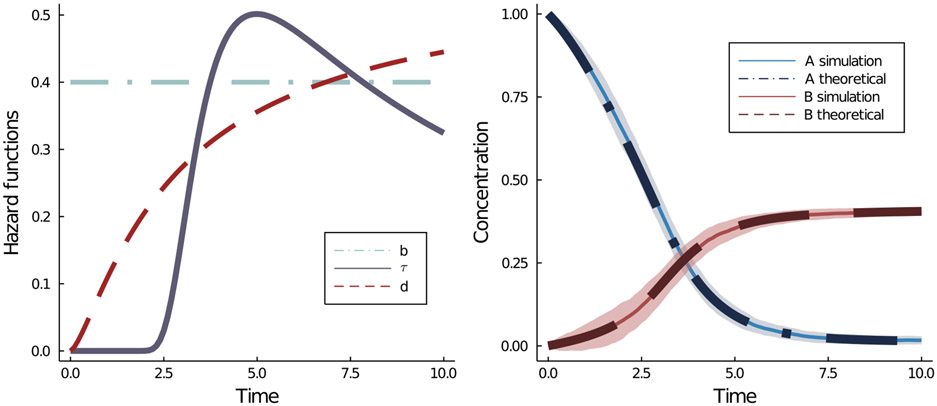
Figure 1.
(Left) The shapes of the three hazard functions in the CRN described by Equation (2.1). Here, b = 0.4. The hazard functions τ and d correspond to a Generalized Extreme Value distribution with parameters (1.25/0.30, 1.250, 0.30) and a Gamma distribution with parameters (2.5, 1.75) respectively. Here, the conversion reaction has been explicitly made a delayed one. (Right) Comparison of the theoretical limiting trajectory and the simulated trajectories of concentrations of A and B molecules. The mean of the simulated trajectories is shown in solid lines, while the theoretical mean curve (given by the PDE limit) is shown in dashed lines. The width of the ribbons indicate 1 standard derivation fluctuation around the mean. Here, n = 100, i.e., the initial number of A molecules is 100. It is evident that the theoretical limit provides a fairly accurate approximation to the scaled processes.

