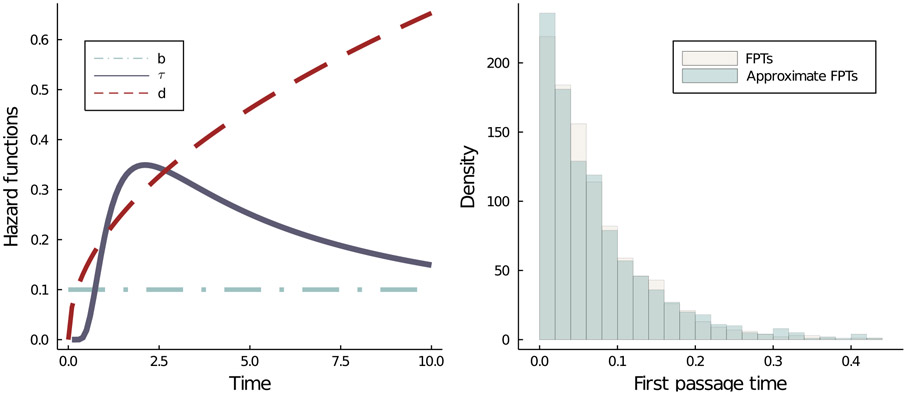
Figure 2.
(Left) The shapes of the three hazard functions in the CRN described by Equation (2.1). Here, b = 0.1. The hazard functions τ and d characterize an Inverse Gamma distribution with parameters (1.75, 4.25) and a Weibull distribution with parameters (1.5, 3.75) respectively. (Right) The density of approximate First Passage Times (FPTs) match that of the true FPTs. Here, n = 100.

