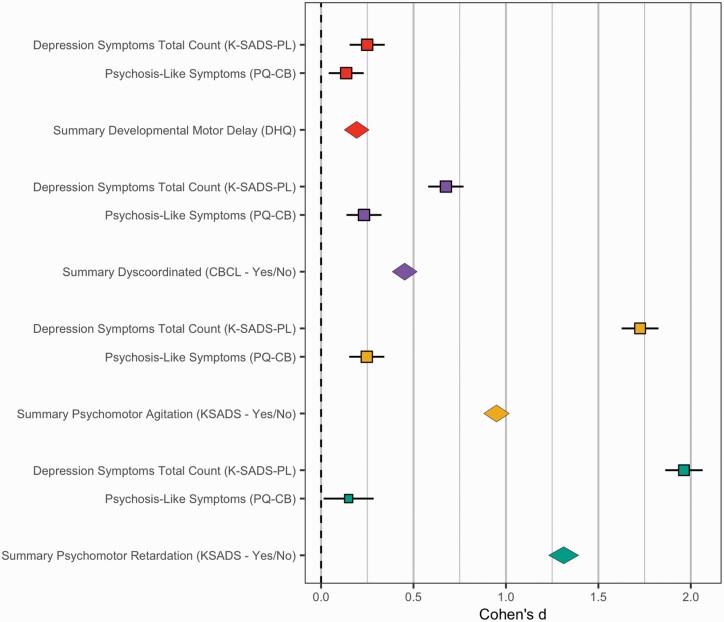
Fig. 1.
Motor signs by lifetime depression and psychotic-like symptoms. Developmental Motor Delays—Red, Dyscoordination Symptoms—Purple, Psychomotor Retardation—Yellow, Psychomotor Agitation—Green. In this figure, the Cohen’s d reflects the difference between individuals who endorsed a motor sign compared to those who did not. As a result, the 0 point reflects the prevalence of motor signs from individuals that did not endorse a motor sign. If the error bars overlap with the 0 point, this indicates that the group did not differ compared to the no motor sign group. Values to the right of the 0 point indicate elevated symptom levels or rates compared to the normative/control sample. Values to the left indicate reduced symptom levels or rates compared to this normative group. The standard deviation of Cohen’s d was estimated in an open source algorithm, freely available in R Michaela package using validated formulas from meta-analytic literature.44 Data was visualized with the metaviz package.45

