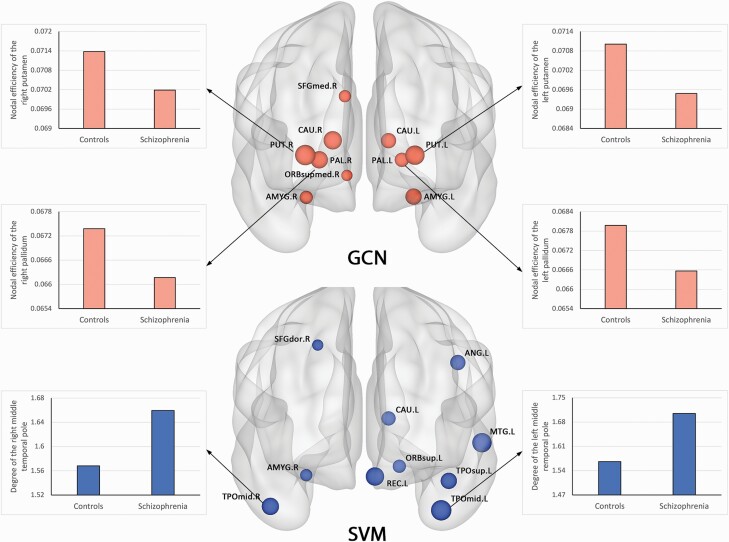
Fig. 2.
Top 10 salient regions contributing to GCN and SVM classification. The size of each region indicates the magnitude of contribution. Bar plots are used to illustrate statistically significant differences in topological characteristics between patients with schizophrenia and controls. Note: AMYG, amygdale; ANG, angular gyrus; CAU, caudate; GCN, graph convolutional network; MTG, middle temporal gyrus; ORBsup, orbitofrontal gyrus, superior part; ORBsupmed, orbitofrontal gyrus, superior medial part; PAL, pallidum; PUT, putamen; REC, rectus; SFGdor, superior frontal gyrus, dorsal part; SFGmed, superior frontal gyrus, medial part; SVM, support vector machine; TPOmid, temporal pole, middle part; TPOsup, temporal pole, superior part.

