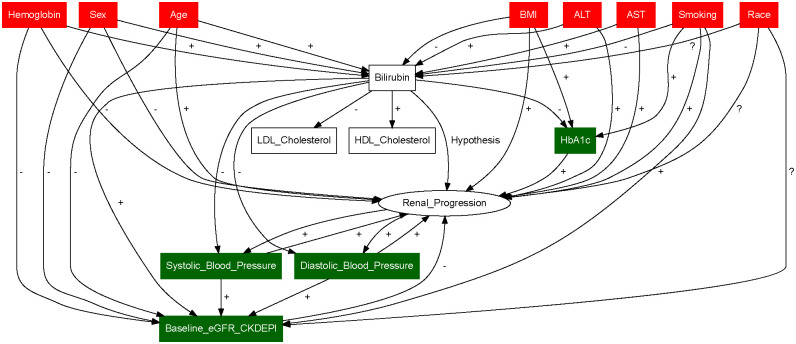
Fig 3. Directed Acyclic Graph (DAG) for the effect of serum bilirubin on renal progression.
Arrows denote the known or suspected causal effect (regardless of the effect size). Red nodes are the covariates that are identified as confounders, and green nodes are the covariates that are identified to be mediators. As the total effects of the bilirubin are our interest, we adjust only for confounders and not for mediators. +—and? indicate the positive, negative and unspecific known or suspected causal association.

