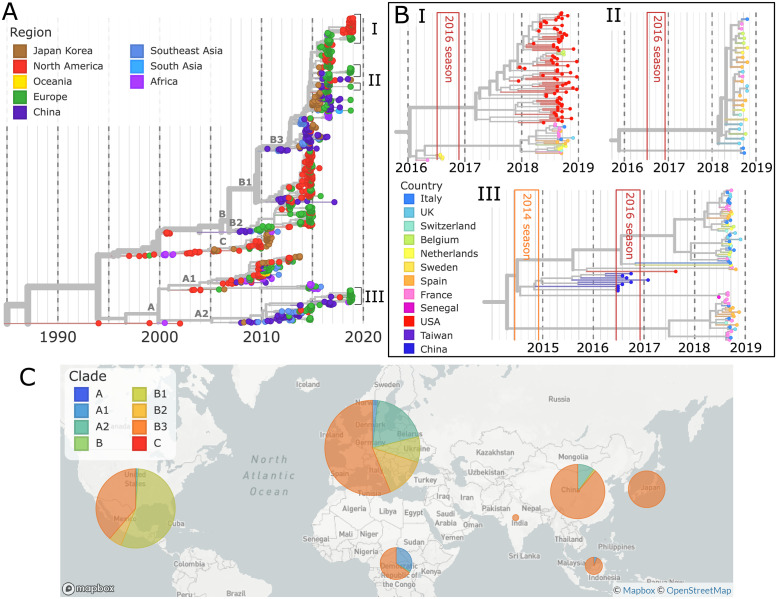
Fig 1. Time-scaled phylogeny of Enterovirus D68.
A) A time-scaled phylogeny of VP1 segments, colored by region, is shown top-left. B) Key clusters (I, II, III), the largest from the 2018 season, are highlighted, colored by country. To display these clusters at a high resolution, the whole genome phylogenies are used. The 2014 and 2016 EV-D68 seasons are shown in orange and red boxes. C) A map shows the distribution of subclades by region from 2014–2018. Map from Mapbox and OpenStreetMap.

