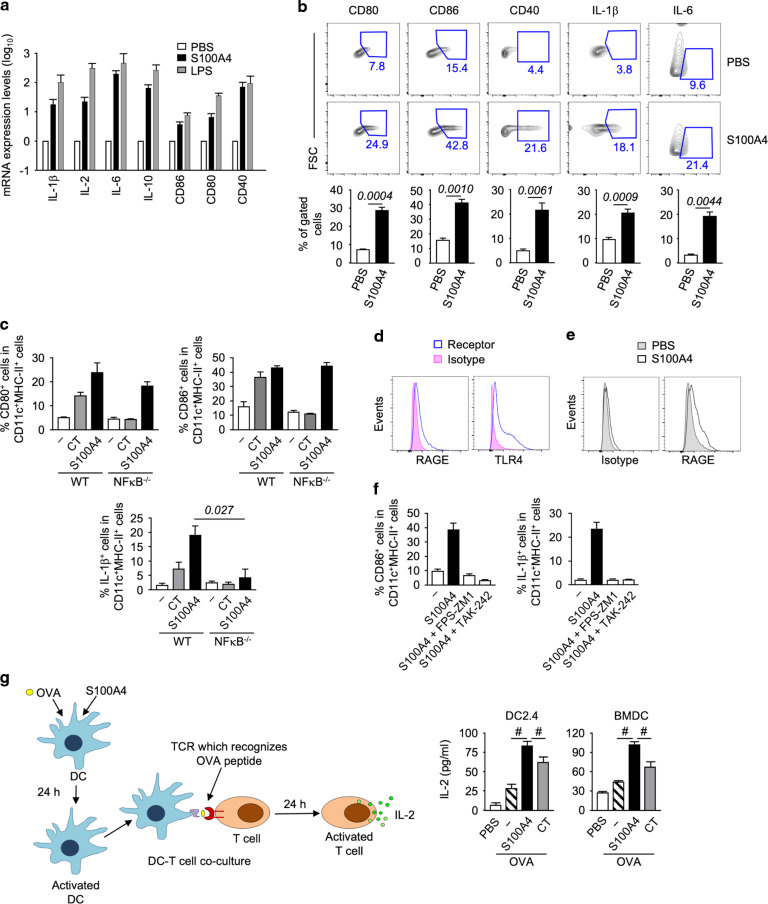
Fig. 6. S100A4 activates dendritic cells.
a, b Bone marrow-derived dendritic cells (BMDCs) were incubated with or without 1 μg/ml S100A4 for 3 h (a) or overnight (b). Some cells were stimulated with 1 μg/ml LPS as a positive control. Expression of a number of molecules important for DC activation as indicated was analyzed at the mRNA level by quantitative reverse transcription PCR (a) or at the protein level by flow cytometry (b; the lower panel shows the quantification). c BMDCs were cultured from wild-type or NFκB-deficient mice followed by incubation overnight with or without S100A4 or cholera toxin (CT; 0.1 μg/ml). Cell surface expression of CD80 and CD86, and intracellular production of IL-1β were measured by flow cytometry. d BMDCs were incubated with anti-RAGE (left panel) or anti-TLR4 (right panel), or with isotype control antibodies, followed by flow cytometric analysis. e BMDCs were incubated with or without S100A4 and their surface expression of RAGE was determined as explained in (d). f BMDCs were incubated overnight with S100A4 or S100A4 pre-mixed with FPS-ZM1 or TAK-242, inhibitors of RAGE and TLR4, respectively. Cell surface expression of CD86 (left panel) and intracellular production of IL-1β (right panel) were measured by flow cytometry as explained in (b). g BMDCs or a DC cell line (DC2.4) were treated with OVA (1 mg/ml) mixed with or without S100A4 (1 μg/ml) or CT (1 μg/ml) overnight before co-culturing with RF33.70 hybridoma (T cells with T cell receptor specific for the OVA257-264 peptide) at a 1:1 (BMDC to RF33.70) or 1:10 (DC2.4 to RF33.70) ratio overnight. T cell activation was quantified by measuring IL-2 release using ELISA, with a schematic diagram showing the experimental design. Expression was normalized using GAPDH as the calibrator gene (a). Representative data out of at least three separate BMDC cultures are shown (d, e), or data are expressed as mean + s.e.m. of 3–4 individual cell cultures (a, b, c, f, g). #P = 0.0022 or the exact P value (italic number) is indicated by Mann–Whitney U test (c, g). Alternatively, the exact P values (italic numbers) are indicated by unpaired t-test (b).

