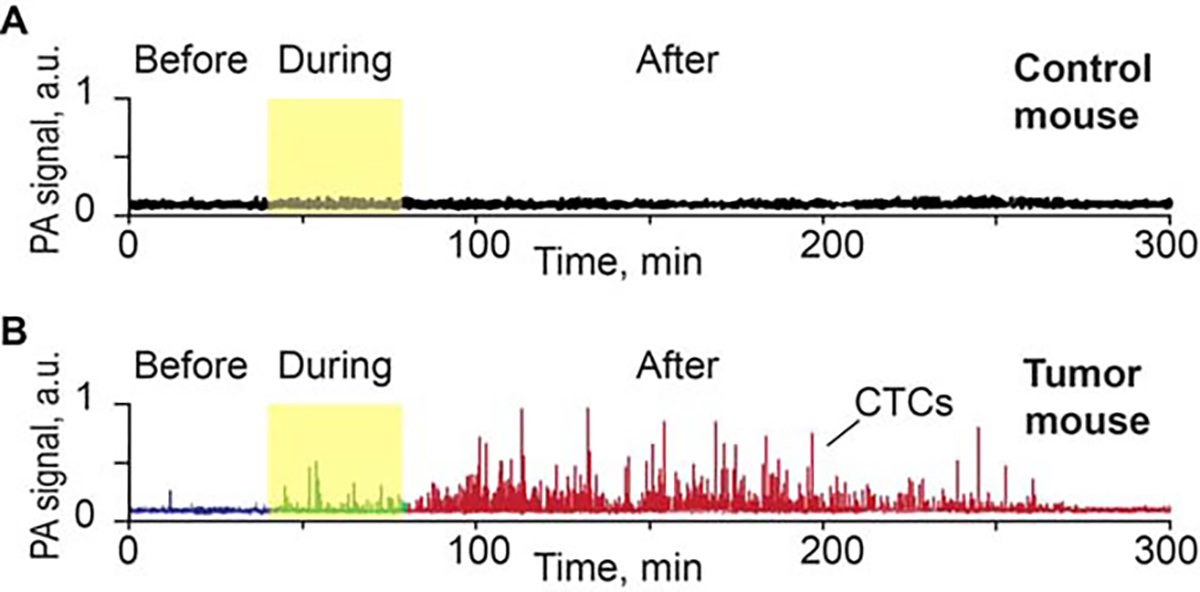
FIGURE 3.

(A) Example of photoacoustic (PA) signal trace before, during, and after pressure (120 g) on back skin and muscle of a control nude mouse (no tumor). (B) Example of PA signal trace before, during, and after pressure on approximately 5-mm melanoma tumor model (B16F10-green fluorescent protein [GFP]) on the nude mouse back. CTC, circulating tumor cell.
