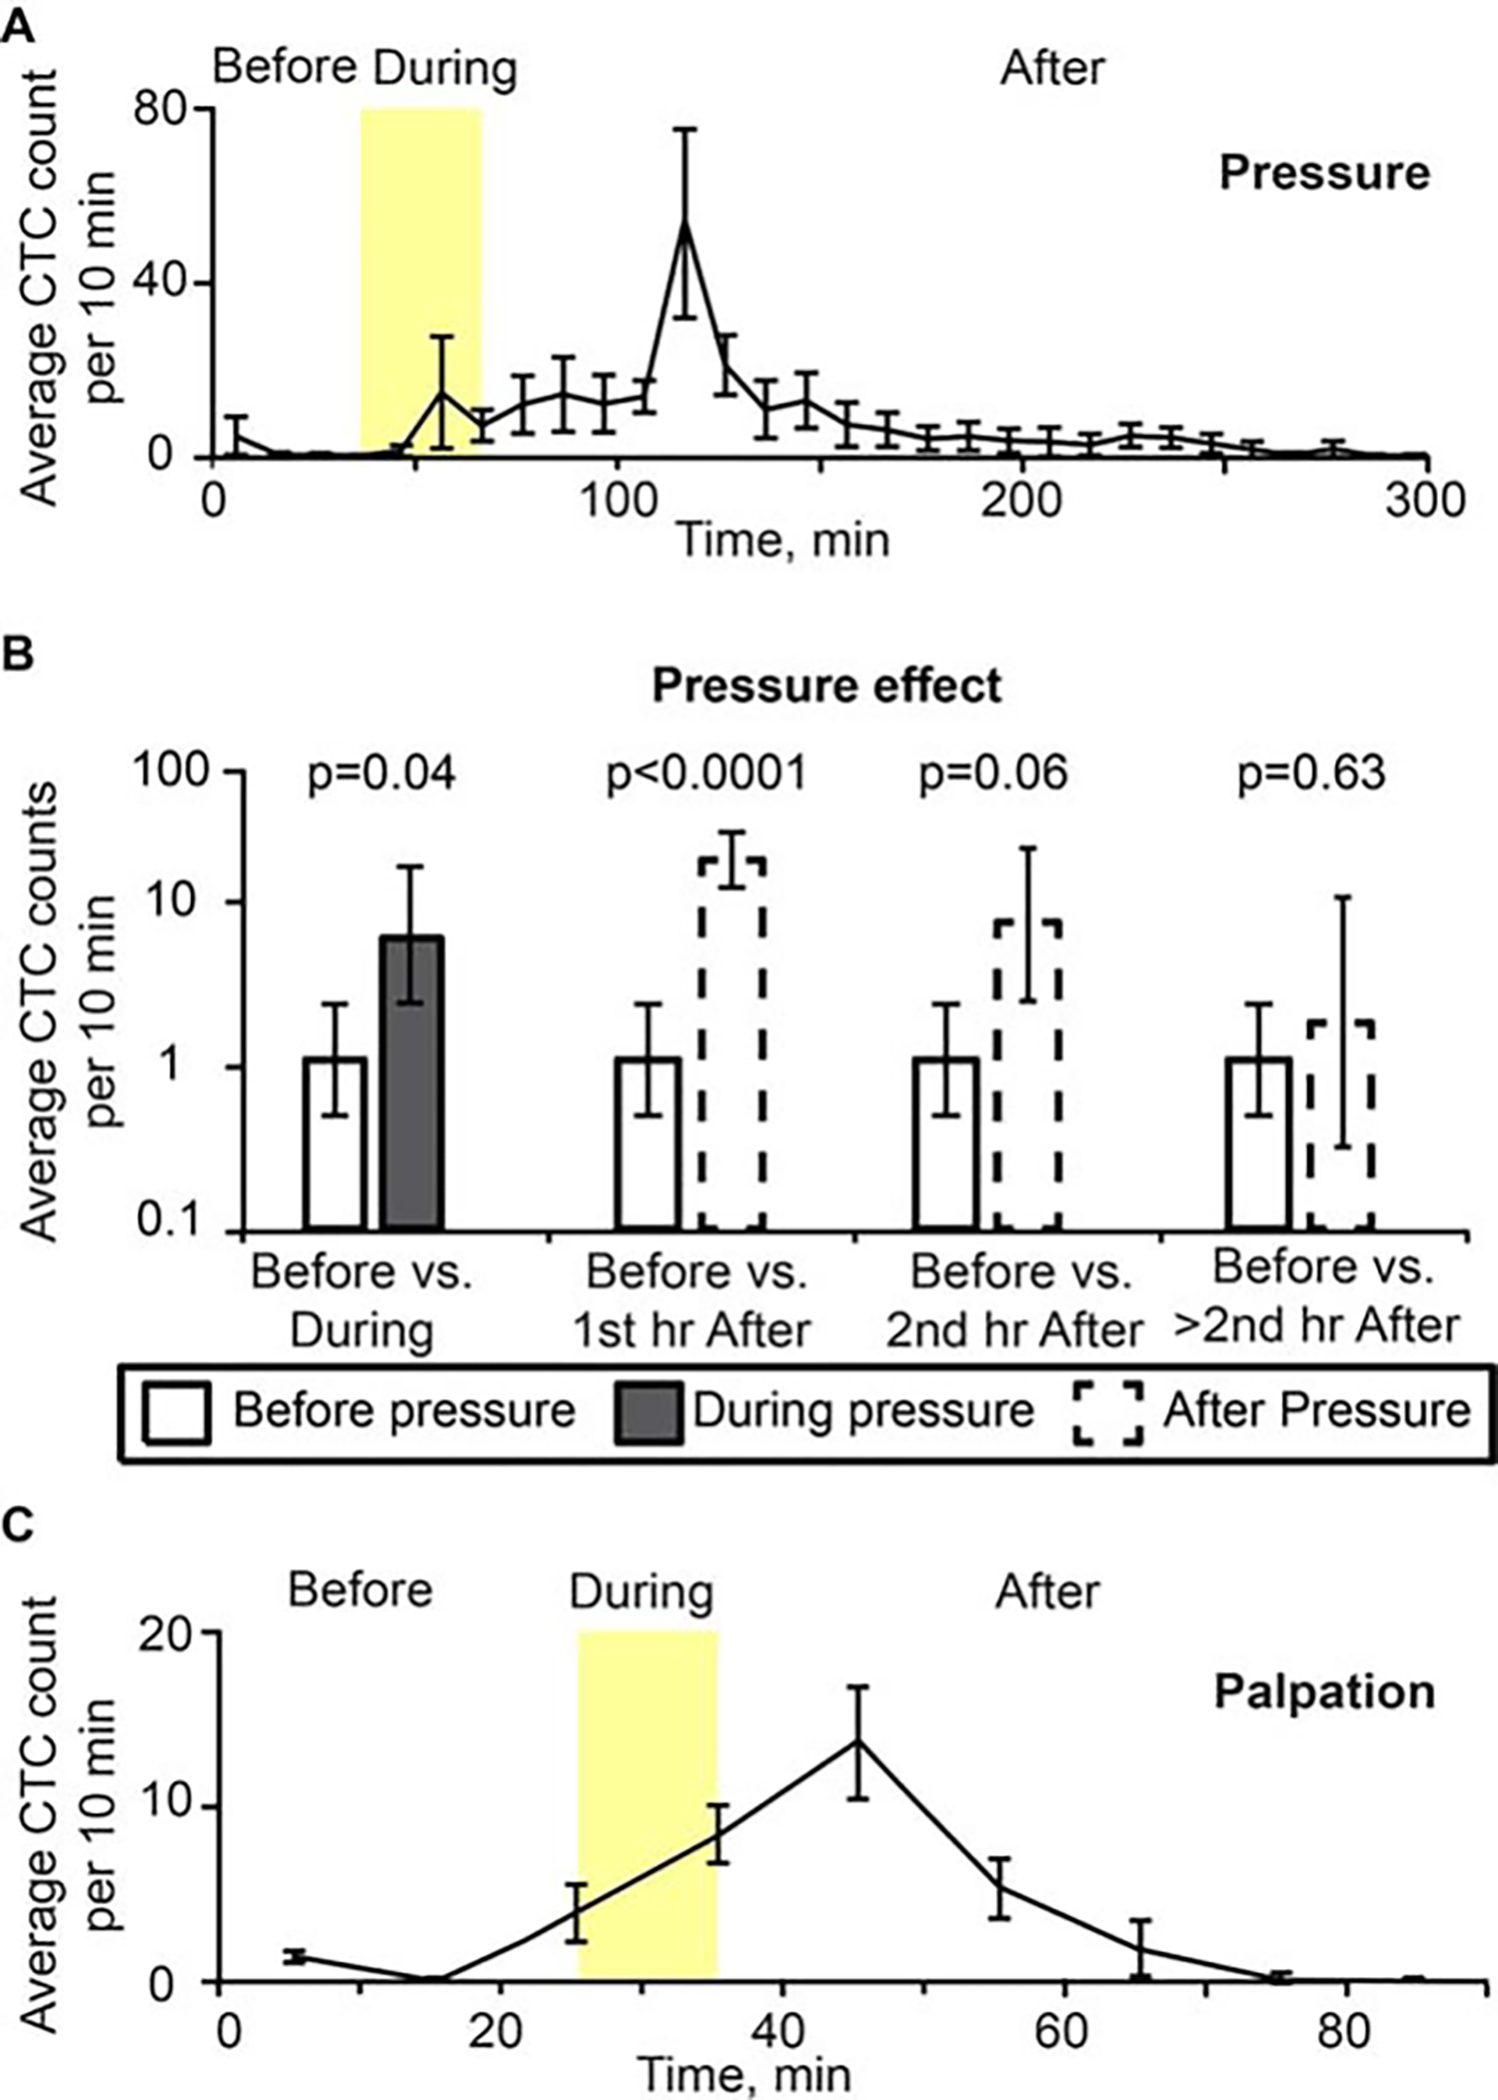
FIGURE 4.

(A) Dynamic of average number of signals per 10 minutes associated with circulating melanoma cells (B16F10-green fluorescent protein [GFP] cells) for 40 minutes before, 30 minutes during (yellow region), and 230 minutes after removing pressure provided by a cylindrical 120 g weight with 10-mm diameter for 30 minutes. Count of peaks are at the midpoint between 0 and 10 minutes, and so on. Values and error bars represent the averages and SDs of CTC counts from 5 mice during each 10-minute bin. Each procedure was performed and repeated 5 times in 5 different mice. (B) Pressure effect on CTC detection rate. Values (error bars) represent the estimates (90% confidence intervals) of CTC number per 10 minutes before pressure versus during and after pressure, as determined from mixed-models Poisson-regression analysis. (C) Histogram of average CTC signal number per 10 minutes from before, during (approximately 10 minutes, yellow region), and after squeezing the tumor (MDA-MB-231-GFP). Values (error bars) represent the averages (SDs) of CTC counts from 3 mice during each 10-minute bin.
