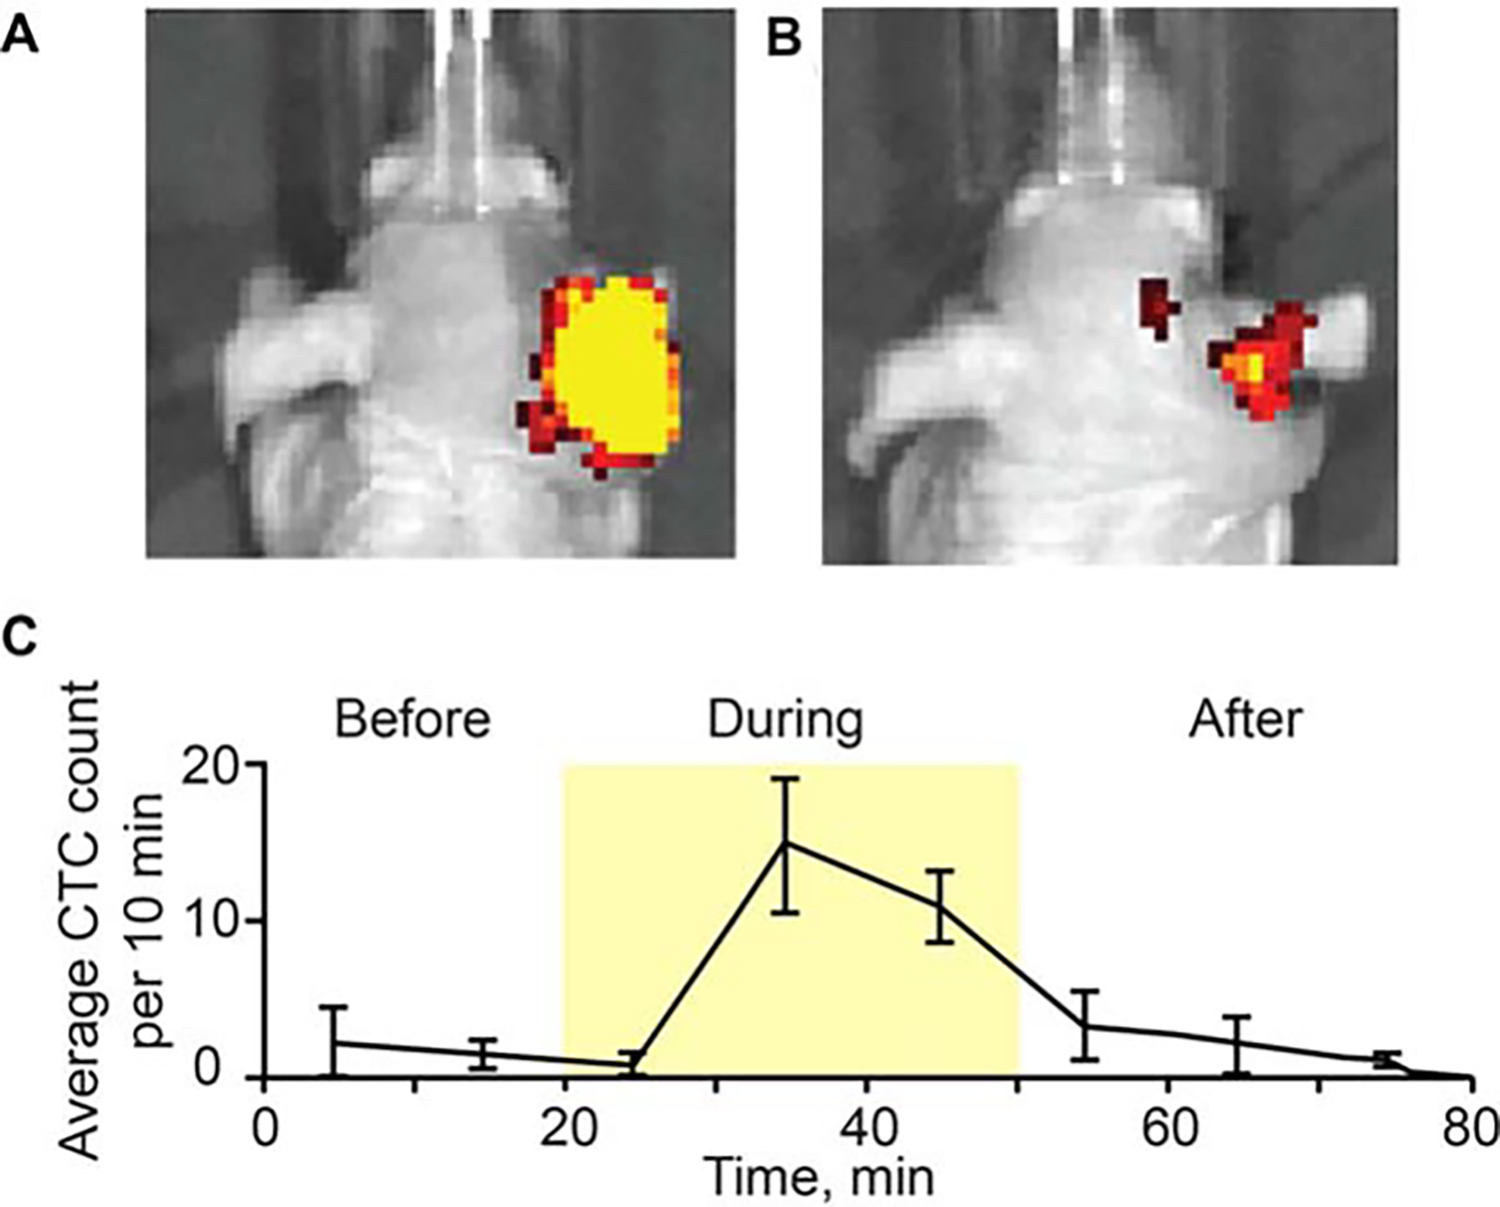
FIGURE 8.

Photoacoustic (PA) monitoring of breast circulating tumor cell (CTC) release during laser exposure. Whole body mouse images were obtained using the IVIS200 Imaging System (Caliper Life Sciences) before (A) and after (B) laser exposure of primary breast tumor in the right ear (MDA-MB-231-green fluorescent protein [GFP]). (C) Dynamic of CTC counts before, during and after laser exposure. Values and error bars represent the averages and SDs of CTC counts from 3 mice during each 10-minute bin.
