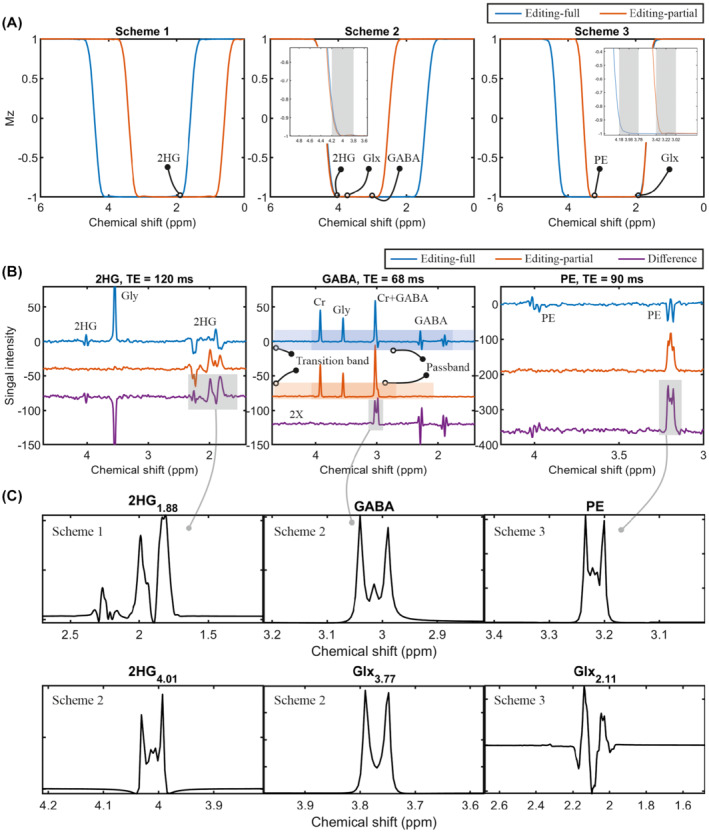
FIGURE 4.

SLOW‐editing schemes with phantom measurements and simulations. A, Simulation of the adiabatic pulse (used as inversion pulse in the simulation for simplicity) in three editing schemes: Scheme 1 for 2HG4.01 editing; scheme 2 for GABA editing (inserted figure with finer scale), and scheme 3 for PE editing (inserted figure with finer scale). B, In vitro measurements to detect 2HG, GABA, and PE using editing scheme 1, 2, and 3, respectively. The pass band and transition‐band are indicated by blue/orange and light blue/orange for editing‐full and editing‐partial pulses, respectively. TE = 120 ms (2HG), 68 ms (GABA), and 90 ms (PE), TR = 1500 ms, spatial resolution = 4.3 × 4.3–11 × 11–18.3 mm, and total measurement time less than 10 min. C, The corresponding metabolites simulation with three editing schemes (2HG1.88 for scheme 1; 2HG4.01, GABA, and Glx3.77 [glutamate/glutamine = 2:1] for scheme 2; PE and Glx2.11 [glutamate/glutamine = 2:1] for scheme 3). The TE‐s are 120, 68, and 90 ms, respectively
