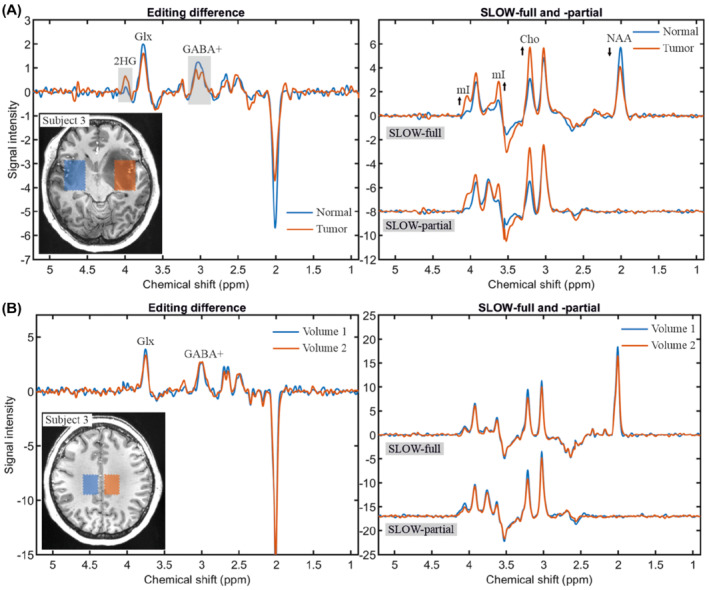
FIGURE 5.

In vivo measurement of 2HG and GABA+ using SLOW‐editing scheme 2. A, The editing difference, SLOW‐full and ‐partial in the normal (blue) and tumor (orange) tissues. The selected volumes (30.1 × 38.7 × 7.8 mm, 7 × 9 × 1 = 63 voxels) are indicated on the left T1‐weighted MRI. B, The editing difference, SLOW‐full and ‐partial in the left normal (blue) and right normal (orange) tissues of the same subject, but at different localization. The selected volumes (21.5 × 30.1 × 7.8 mm, 5 × 7 × 1 = 35 voxels) are indicated on the left T1‐weighted MRI. TE = 68 ms, TR = 1500 ms, matrix = 65 × 23 × 9 (4.3 × 7.8 × 7.8 mm), and measurement time = 9:04 min
