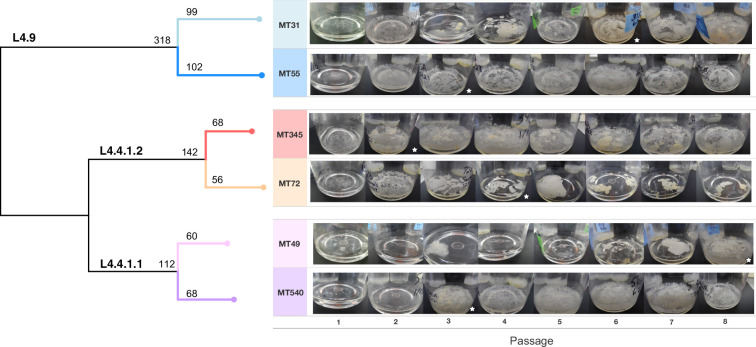
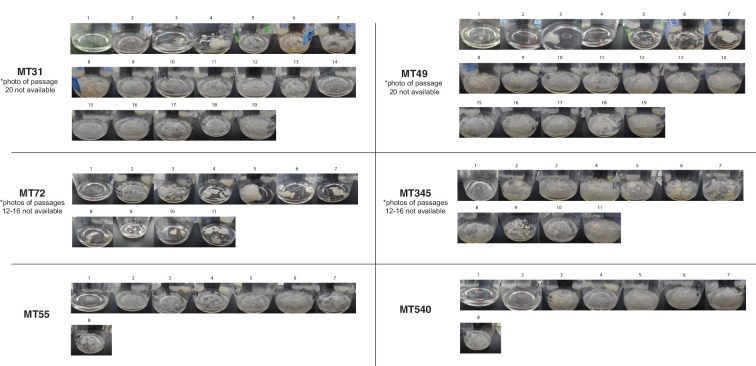
Figure 1. Whole genome sequence phylogeny of ancestral populations used for passaging and photos of pellicles throughout the experiment.
Populations fall into three clades with single-nucleotide polymorphism distances given for each sub-lineage and strain. Pellicle photos show rapid change in phenotype, followed by stabilization through the rest of the experiment. The star indicates the passage at which point we determined the pellicle phenotype to be stabilized for each population. Photos of pellicles were taken after 5–7 weeks of growth.


