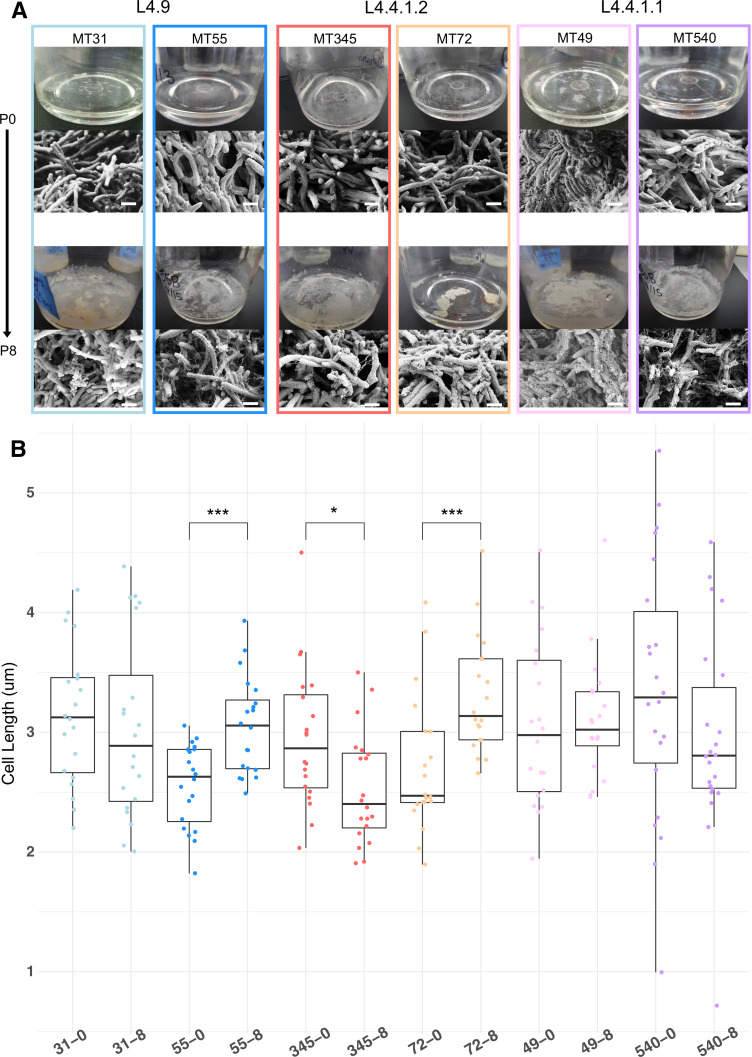
Figure 2. Phenotypic changes in evolved bacterial populations: cell size & matrix production.
(A) SEM images of ancestral and evolved biofilms show changes in extracellular matrix and (B) cell length. SEMs were taken after 5 weeks of biofilm growth, shown alongside photo of pellicle from that passage. Cell lengths were measured across two biological replicates for each strain, except MT540-0 for which only one replicate was available. Each dot represents a single cell length measurement. Significant differences (Kruskal–Wallis p-value=3.43e-05) in cell length between ancestral and evolved pairs shown across the top of panel B (Mann-Whitney U test with Benjamini-Hochberg correction). Scale bars in lower right side of SEM images = 1 μm. p-value legend: *p<0.05, **p<0.01, ***p<0.001.

