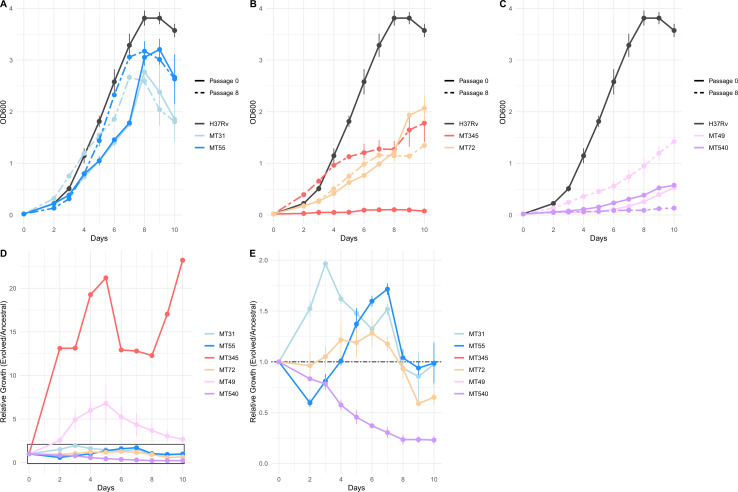
Figure 4. Impacts of pellicle passaging on planktonic growth rate vary by genetic background.
(A, B, C) Planktonic growth and (D, E) relative fitness curves comparing the growth of strains after eight pellicle passages to the ancestral strains. Growth curves were performed in triplicate, and the mean OD600 value is plotted with error bars representing ±1 SD. Relative fitness was calculated at each timepoint as OD600 Passage 8 / OD600 Passage 0. Panel E shows boxed region from panel D in more detail.

