. 2022 Jun 21;11:e78454. doi: 10.7554/eLife.78454

Figure 6. Trajectories of mutations that changed ≥30% over the course of the experiment show few mutations arose during passaging.

The mutations that became fixed almost always did so in the first or second sequenced passage (Supplementary file 1), and we identified very few mutations with substantial declines in frequency. Mutation frequency data were calculated with Popoolation2 and plots were made using Lolipop (see Methods).

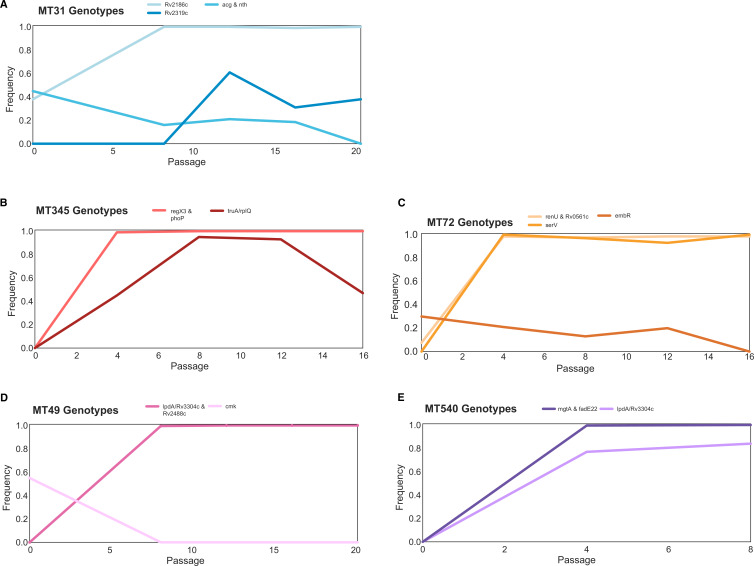
Figure 6.

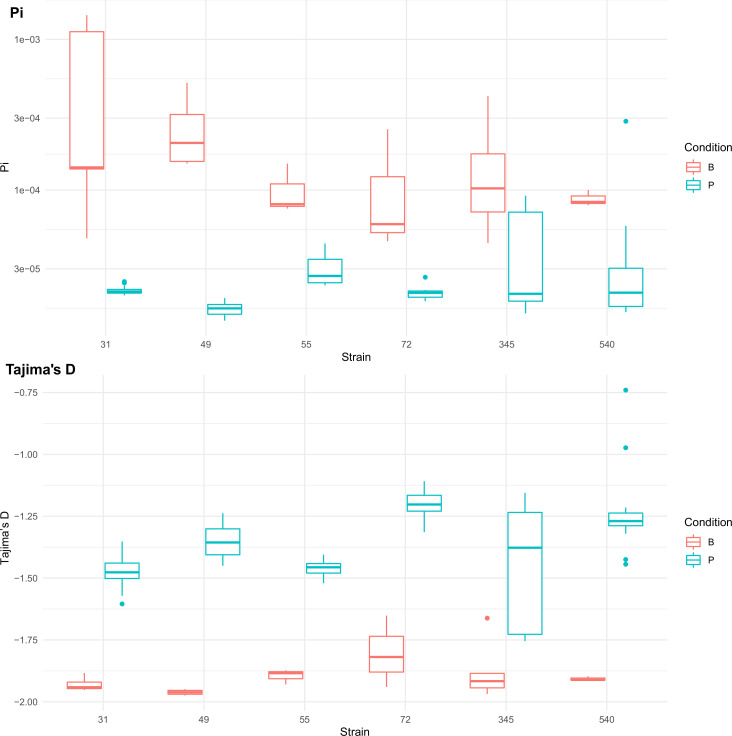
Figure 6—figure supplement 1. Population genetics statistics calculated from Pool-seq data from all strains at all sequenced passage points.

Figure 6—figure supplement 1.

Range of values across all sequenced passage points given for each statistic. Boxplots are colored by strains passaged as biofilms (red) or passaged as planktonic cultures (blue).
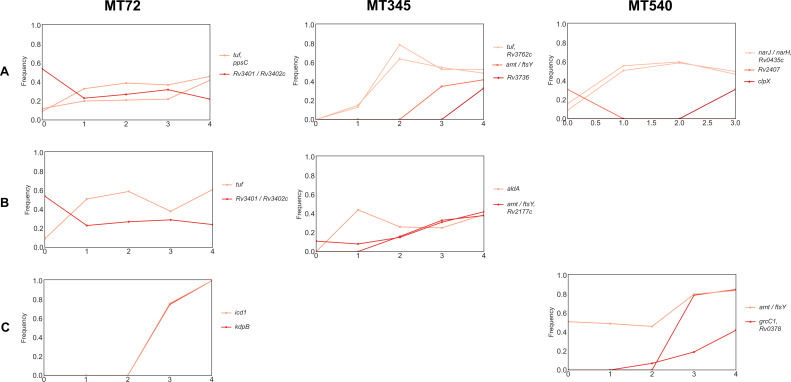
Figure 6—figure supplement 2. Trajectories of mutations that changed ≥30% over the course of planktonic passaging.

Figure 6—figure supplement 2.

In contrast to strains evolved under biofilm conditions, only two mutations became fixed (both in MT72-C).