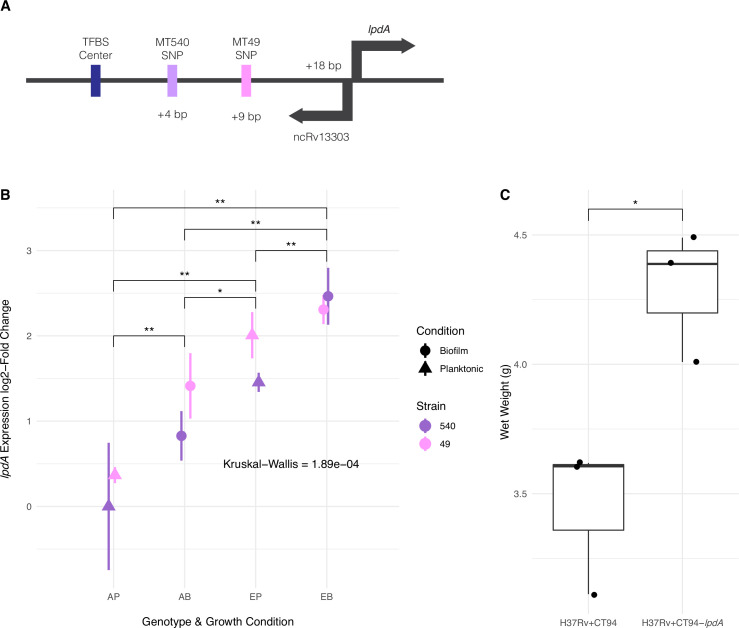
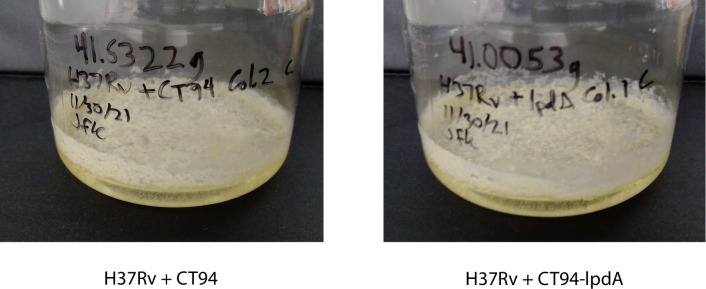
Figure 7. Adaptation to pellicle growth via increased expression of lpdA.
(A) Diagram of convergent adaptation in L4.4.1.1 strains MT540 and MT49 in the region upstream of lpdA within a transcription factor binding site (TFBS) and non-coding RNA. (B) Expression of lpdA differed significantly between sample groups (Kruskal–Wallis test, p-value=1.89e-04). Pairwise comparisons between groups (n=3, Mann-Whitney U test with Benjamini-Hochberg correction) revealed significantly increased expression in evolved (E) strains when compared with ancestral (A) strains, as well as during biofilm (B) growth when compared with planktonic (P) growth. (C) Overexpression of lpdA in H37Rv results in significantly (n=3 for each construct, Mann-Whitney U test) increased biofilm wet weights. p-value legend: *p<0.05, **p<0.01.


