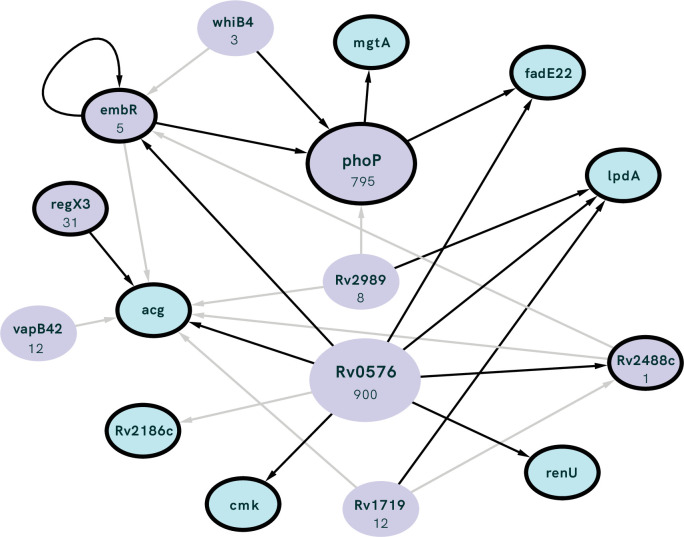
Figure 9. Interconnected regulation of our genes of interest (GOI; outlined in black) by common transcription factors (TFs; purple) with the number of genes regulated by each TF listed under gene name.
TF identified as having significant overlap with our GOI (i.e. the number of GOI regulated by the TF is higher than expected by chance) using the MTB Network Portal (see Methods). Edges between nodes indicate >0.5 log2-fold absolute change in expression in a transcription factor overexpression strain, black lines show statistically significant (p<0.05) differential expression.

