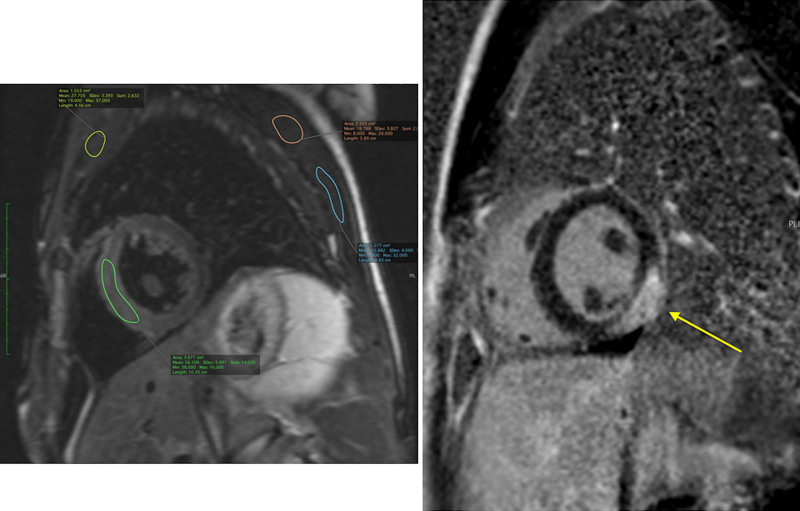
Figure 46.
On the left is a CMR T2 weighted sequence showing > 2X enhancement of myocardium (green region of interest, ROI) compared to skeletal muscle (yellow, pink or blue ROI), meeting criteria for myocardial edema per 2009 Lake Louise criteria. On the right is a post-contrast phase sensitive inversion recovery (PSIR) sequence showing sub-epicardial late gadolinium enhancement indicating necrosis or scar (yellow arrow).

