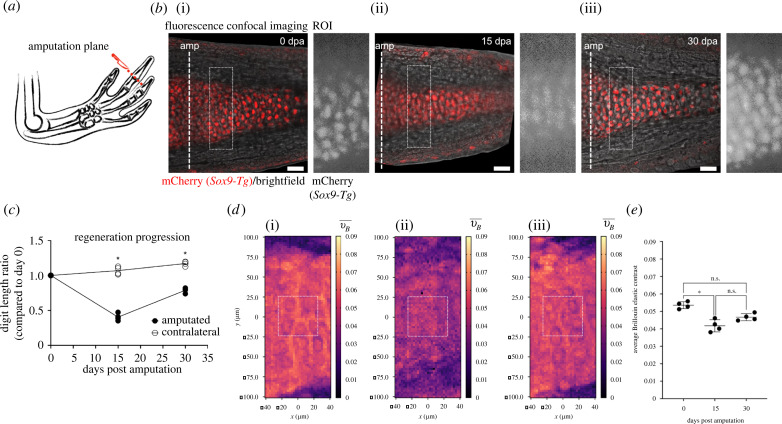
Figure 4.
Brillouin elastic contrast increases as cartilage condensates during digit regeneration. (a) Schematic representation of amputation plane at the joint of the distal phalanx, generated with Keynote. (b) Confocal live imaging of digit II from Sox9-mCherry axolotl (i) before amputation (0 days post-amputation, dpa), and at (ii) 15 dpa and (iii) 30 dpa. Images represent a composite between brightfield and maximum intensity Z-stack projection of four optical slices for the mCherry signal. Dashed line at 0 dpa shows the amputation plane (amp). Dashed rectangles show ROI which was probed with the confocal Brillouin microscope. A widefield fluorescence image taken with Brillouin set-up of the ROI is shown to the right of each timepoint. Scale bar: 50 µm. (c) Regeneration progression as shown by the digit length ratio at each time point. (i) 0 dpa, (ii) 15 dpa, (iii) 30 dpa. Ratio was calculated comparing each digit length with respect to day 0. Line is connecting mean values. NA = 4, Mann–Whitney test, *p < 0.05, amputated versus contralateral. (d) Brillouin elastic contrast () maps for ROIs shown in (b). White squares represent the region quantified in (e). Changes in values were observed inside the cartilage at different timepoints. (e) Average in cartilage during regeneration. NA = 4, Friedman ANOVA with Dunn's post hoc analysis, *p < 0.05.

