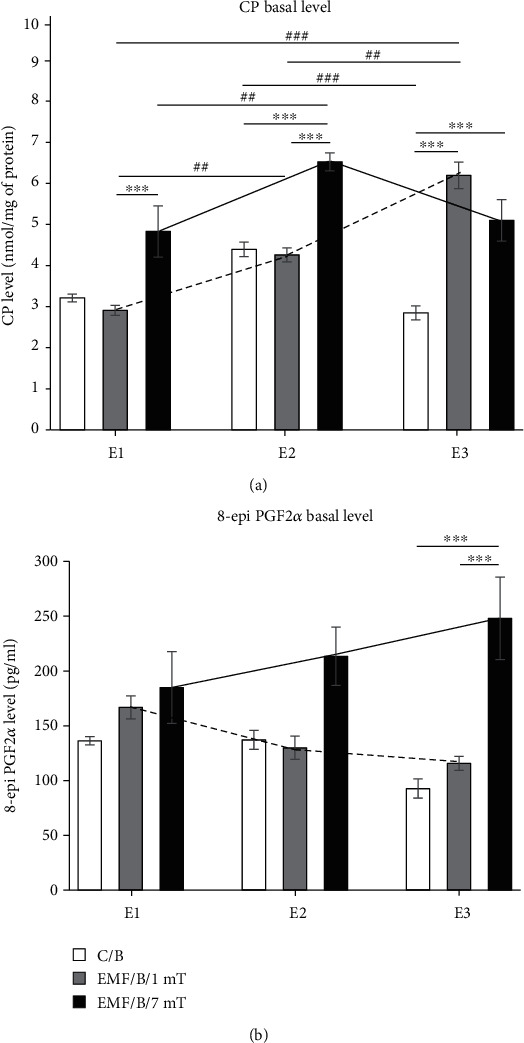
Figure 3.

The basal level of oxidative stress markers: (a) CP groups and (b) 8-epi PGF2α in the prefrontal cortex of rat's brain. Animals were exposed once to three times (E1-E3) to EMF of 1 or 7 mT or control conditions. Values are presented as mean ± SEM. The lines show the direction of changes in the level of stress markers in 1 mT (dotted line) and 7 mT (solid line) groups after each subsequent exposure. Statistically significant differences between animals from the same group are denoted ##P < 0.01 and ###P < 0.001; and these between experimental groups are denoted ∗∗∗P < 0.001.
