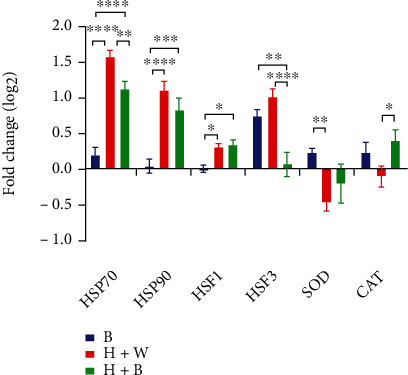
Figure 3.

Expression of HSPs, HSFs, and antioxidant enzyme genes. The expression levels were presented as log2 fold change and shown in the figure as mean ± SEM. ∗, ∗∗, ∗∗∗, and ∗∗∗∗ denote statistical significance (two-way ANOVA) with P < 0.05, P < 0.01, P < 0.001, and P < 0.0001, respectively.
