Figure 7.

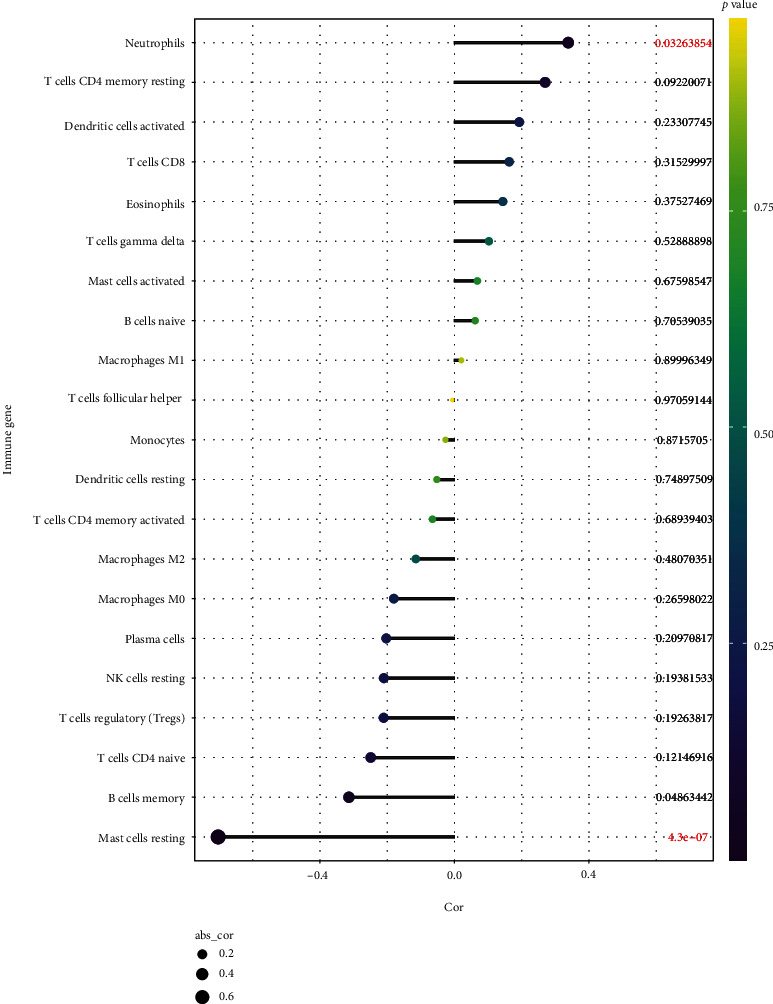
Spearman correlation between immune cell subsets and DUSP1. The color of dots denotes the P value. The size of dots denotes the strength of correlation.

Spearman correlation between immune cell subsets and DUSP1. The color of dots denotes the P value. The size of dots denotes the strength of correlation.