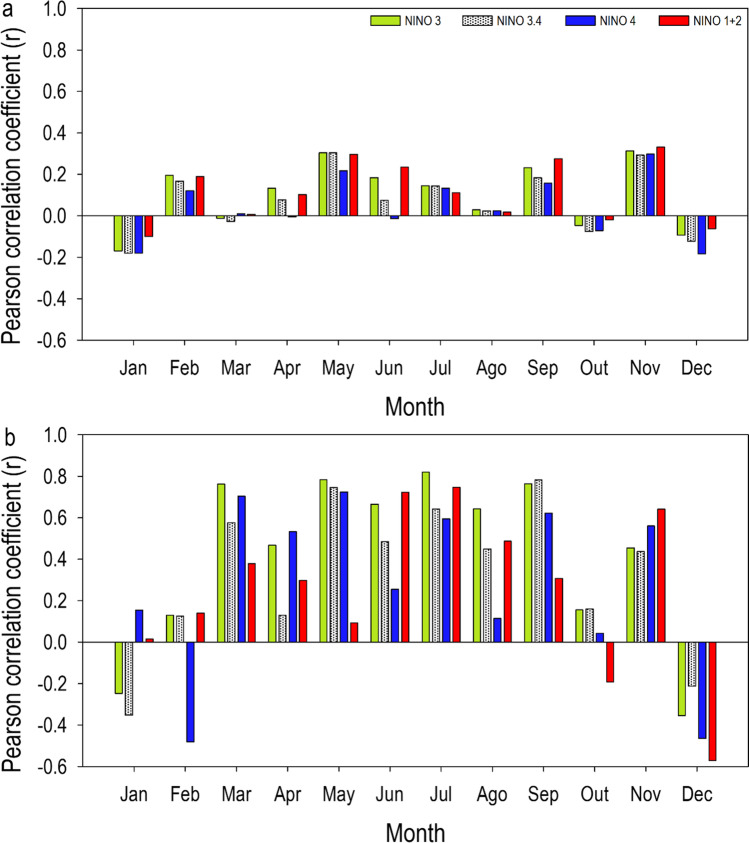
Fig. 12.
Coefficient of correlation of rainfall (RM) anomalies (baseline period: 1951–2000) between ESALQ’s conventional weather station (CWS) and Niño SST indices regions (NOAA time series): a observed monthly; b 30-year moving average (1917–2016). Bar colors match with colors of Niño SST indices regions map (see Fig. 2)

