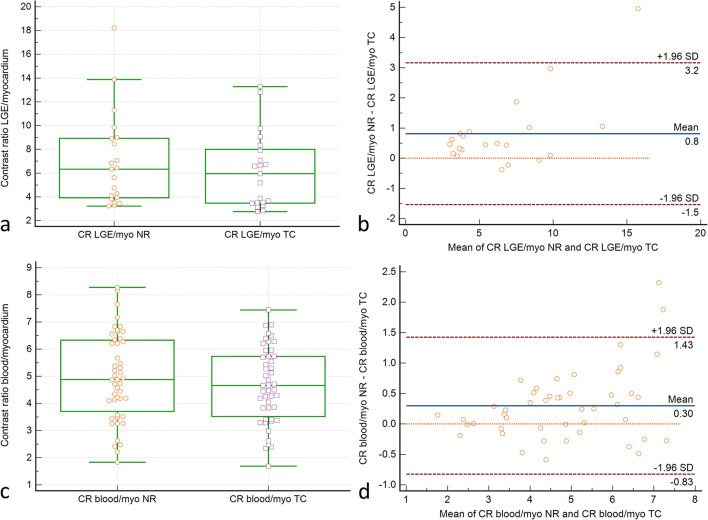
Fig. 2.
Pairwise comparison of LGE–myocardium (a, b) and blood–myocardium (c, d) contrast ratios in the translational (TC) and combined translational/non-rigid (NRC) motion-corrected datasets. Box plots (a, c): Indicated are the median values (middle line), 25 and 75 percentiles (central box), and single values (dots). The whiskers extend from the minimum to the maximum value, excluding outliers that are outside the lower/upper quartile minus/plus 1.5 times the interquartile range. a, c Higher LGE–myocardium and blood–myocardium contrast ratios in NRC (p < 0.001 resp. 0.001). Bland-Altman plots (b, d): ∆contrast ratio is shown on the ordinate. The mean of TC and NRC contrast ratios is shown on the abscissa. Indicated are the limits of agreement (± 1.96* SD), the line of equality, and the mean difference. NRC contrast ratios are generally higher than TC contrast ratios. This is particularly true for LGE–myocardium contrast ratios

