Fig. 1.
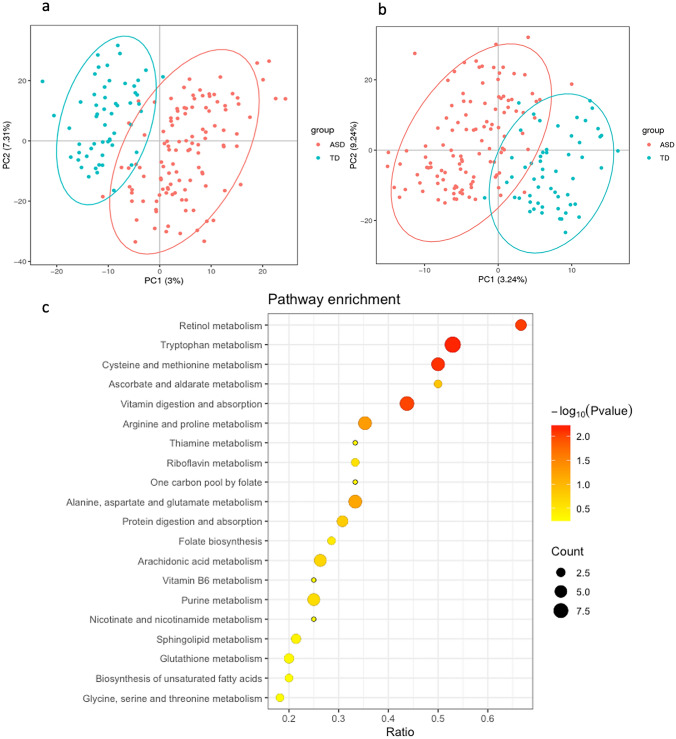
Alterations of the gut metabolome in children with ASD compared with TD children. a, b The clustering analyses of partial least-squares discriminant analysis (PLS-DA) of gut metabolome data in the positive ion mode (a) and negative ion mode (b). c Top 20 KEGG pathways enriched by differential gut metabolites between the ASD and TD children. Count, the number of differential metabolites in the pathway. Ratio, the ratio of number of differential metabolites to all detected metabolites in the pathway. p value, p value of hypergeometric test. ASD autism spectrum disorders, TD typically developing

